Measurement
250 likes | 263 Views
Learn the fundamentals of measurement, accuracy, precision, and sources of error in physics experiments. Calculate accuracy and precision, understand significant digits, and identify sources of error.

Measurement
E N D
Presentation Transcript
Section Measurement 1.2 Please Do Now • With your lab group, accurately and precisely measure and record the length, width, and thickness of your Physics textbook. • Calculate and record the volume of the book. Include proper units and the correct amount of decimal places. • Record your answers on the board.
Section Measurement 1.2
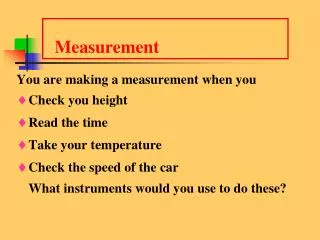
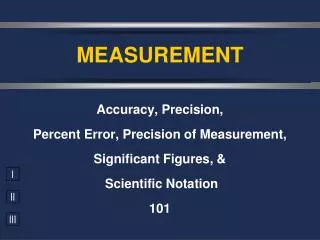
Section Measurement 1.2 In this section you will: • Distinguish between accuracy and precision. • Determine the precision of measured quantities. • Understand the use of error bars in analyzing data. • Learn how to calculate percent error and percent deviation. • Understand that “sources of error” is different from making errors.
Section Measurement 1.2 What is a Measurement? • A measurement is a comparison between an unknown quantity and a standard. • Measurements quantify observations. • Careful measurements enable you to derive the relation between any two quantities.
Section Measurement 1.2 Comparing Results • When a measurement is made, the results often are reported with an uncertainty. • Therefore, before fully accepting a new data, other scientists examine the experiment, looking for possible sources of error, and try to reproduce the results. • A new measurement that is within the margin of uncertainty confirms the old measurement.
Section Measurement 1.2 Measurements by Three Students
Section Measurement 1.2 Precision vs. Accuracy precision – a characteristic of a measured value describing the degree of exactness of a measurement. - The number of decimal places indicates the precision of a measurement. - The grouping of data also indicates precision. A tight grouping has high precision. accuracy – a characteristic of a measured value that describes how well the results of a measurement agree with the “real” value, which is the accepted value.
Section Measurement 1.2 Precision Versus Accuracy • The precision of a measurement is ½ the smallest division of the instrument.
Section Measurement 1.2
Section Measurement 1.2 Calculating Accuracy and Precision Percent error is used to determine accuracy, or the variation of a measurement compared to a known value. Percent error = |measured value – accepted value | × 100% accepted value Example: The accepted value for the acceleration due to gravity is 9.80 m/s2. The experimental results on the first trial was 8.50 m/s2. What was the percent error? 8.50 m/s2 – 9.80 m/s2 x 100% = 13.3% 9.80 m/s2
Section Measurement 1.2 Calculating Accuracy and Precision Percent deviation is used to determine precision, or a measure of the difference between a single measurement and the average of all measurements. ◦ Percent deviation can be an indicator of how carefully you have taken and recorded your measurements. Percent deviation = | measured value – average value | × 100% average value
Section Measurement 1.2 Techniques of Good Measurement • To assure precision and accuracy, instruments used to make measurements need to be used correctly. • This is important because one common source of error comes from the angle at which an instrument is read. • The precision of a measurement is one-half of the smallest division of the instrument. Read to the line and guess the last digit.
Section Mathematics and Physics 1.1 Significant Digits (Significant Figures or Sig Figs) • Definition: All the valid digits in a measurement, the number of which indicates the measurement’s precision (degree of exactness). Example: A measurement of 63.52 cm indicates there are 63 centimeters, 5 millimeters, and two-tenths of an millimeter (the guess digit). 62 63 64 Read to the line (63.5) and estimate the guess digit (63.52).
Section Mathematics and Physics 1.1 Significant Digits and Precision A measurement of 63.5 cm indicates the smallest division on the ruler is centimeters. A measurement of 63 cm indicates the ruler has divisions every 10 centimeters. 62 63 64 Read to the line (63) and estimate the guess digit (63.5). 50 60 70 Read to the line (60) and estimate the guess digit (63).
Section Measurement 1.2 Sources of Error • A source of error is any factor that may affect the outcome of an experiment. • An “error” to a scientist does not mean “mistake”; it more closely means “uncertainty”. • In an experiment, sources of error accumulate and propagate. • When explaining sources of error in your experiment, do not list “human error”. This term is vague and lazy. Instead, think about specific things that happened during the experiment where the results may have been affected. • Example: Suppose you where measuring the acceleration due to gravity of a falling object. Air resistance introduces error in your calculations.
Section Measurement 1.2 Sources of Error – More Examples • When measuring the magnetic field of a small magnet, you may need to account for the Earth’s magnetic field. • A draft may affect the fall of your paper helicopter. • The temperature of the room may rise during an experiment due to hot plates, climate, body heat. Sources of Error – Non-Examples • I misread the ruler (or scale, or graduated cylinder, etc.) • I miscalculated. (Check your work; then have a lab partner check it.) • Human error. (Never list this in your lab report !!)
Section Section Check 1.2 Question 1 Ronald, Kevin, and Paul perform an experiment to determine the value of acceleration due to gravity on the Earth (980 cm/s2). The following results were obtained: Ronald - 961 ± 12 cm/s2, Kevin - 953 ± 8 cm/s2, and Paul - 942 ± 4 cm/s2. Justify who gets the most accurate and precise value. • Kevin got the most precise and accurate value. • Ronald’s value is the most accurate, while Kevin’s value is the most precise. • Ronald’s value is the most accurate, while Paul’s value is the most precise. • Paul’s value is the most accurate, while Ronald’s value is the most precise.
Section Section Check 1.2 Answer 1 Answer:C Reason:Ronald’s answer is closest to 980 cm/s2 and hence his result is the most accurate. Paul’s measurement is the most precise within 4 cm/s2.
Section Section Check 1.2 Question 2 What is the precision of an instrument? • The smallest division of an instrument. • The least count of an instrument. • One-half of the least count of an instrument. • One-half of the smallest division of an instrument.
Section Section Check 1.2 Answer 2 Answer:D Reason:Precision depends on the instrument and the technique used to make the measurement. Generally, the device with the finest division on its scale produces the most precise measurement. The precision of a measurement is one-half of the smallest division of the instrument.
Section Section Check 1.2 Question 3 A 100-cm long rope was measured with three different scales. The answer obtained with the three scales were: 1st scale - 99 ± 0.5 cm, 2nd scale - 98 ± 0.25 cm, and 3rd scale - 99 ± 1 cm. Which scale has the best precision? • 1st scale • 2nd scale • 3rd scale • Both scale 1 and 3
Section Section Check 1.2 Answer 3 Answer:B Reason:Precision depends on the instrument. The measurement of the 2nd scale is the most precise within 0.25 cm.
Section Section Check 1.2 Question 4 Which of the following could be considered a legitimate source of error in your lab? • The wheels on the cart wobbled a bit, which slowed it down. • It was hard to get an exact reading from the spring scale because my hand shook. • The thermometer may have not yet reached thermal equilibrium. • All of them
Section Section Check 1.2 Answer 4 Answer:D Reason:Remember, “error” is not errors that you made in lab. It is the unwanted factors make your results different from the expected results. It is why your experiment will not exactly match the formula.
d c Section Bulls-eye Lab Activity 1.2 c = 4.31cm d = 3.05 cm Name:_______________________________________ Date:____________ Period:_______