Download
1 / 67
730 likes | 1.03k Views
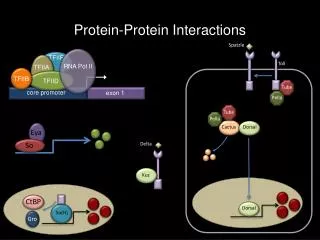
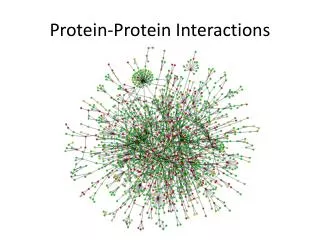
Studying protein-protein interactions Ed Evans, T-cell biology group. Studying Protein-Protein Interactions. INDIRECT (looking for functional association) Correlated mRNA Expression Computational Approaches Phylogenetic Profiling Synthetic Lethality QUALITATIVE The Two-Hybrid Method

E N D
Studying protein-protein interactionsEd Evans, T-cell biology group
Studying Protein-Protein Interactions • INDIRECT (looking for functional association) • Correlated mRNA Expression • Computational Approaches • Phylogenetic Profiling • Synthetic Lethality • QUALITATIVE • The Two-Hybrid Method • Mass Spectrometry of Affinity-Purified Complexes • FRET & BRET • QUANTITATIVE • SPR (BIAcore) • AUC • Calorimetry
Indirect detection of interactions(looking for implied functional association NOT direct interaction)
A. 2. Computational approaches e.g. “Rosetta Stone”
Basic Workflow • Immunoaffinity • TAP tagging • 2D gel • Formaldehyde crosslinking • etc….. MS compatible Silver stain, SYPRO stain Coomassie stain >100 fmol protein LC MSMS PROTEIN IDENTIFICATION Specific Protease e.g. trypsin Gel Q-ToF Micro Mass Spectrometer – LC MSMS Quadrupole Time-of-flight mass spectrometer Protein Digest Peptides Peptide fragments Data acquisition CID Nanospray Ion source Nano HPLC system Peptide sequence
Cross-linking the interaction Non covalent protein complex Thiol cleavable cross-linker Covalently cross-linked complex Digest with Protease MALDI MS Non reduced Thiol reagent MALDI MS Reduced Differential peptide mapping
=> BE WARNED! These techniques (along with e.g. Co-immuniprecipitation) give lots of false positives
B. 3. a. FRET Förster (Fluorescence) Resonance Energy Transfer (FRET) In this strategy, excitation of GFP will result in emission from a nearby protein such as blue fluorescent protein (BFP) if it is physically close enough. The best FRET pairs are actually the cyan and yellow mutants of GFP, referred to as CFP and YFP.
Power of FRET • Probe macromolecular interactions Interaction assumed upon fluorescence decay • Study kinetics of association / dissociation between macromolecules • Estimation of distances (?) • In vitro OR on live cells • Single molecule studies
Live cell FRET imaging Does CD4 specifically associate with the TCR/CD3 complex on triggering? Non-specific peptide Specific peptide * marks contacts between cells. High FRET signal between CD4 and CD3 when correct antigen is present but not with non-specific antigen.
B. 3. b. BRET: Bioluminescence Resonance Energy Transfer hf1 hf2 DeepBlueC GFP2 Luciferase >10nm
BRET vs FRET • BRET analysis can be achieved at physiological levels of protein expression • No problems with photobleaching or photoconversion as seen in FRET techinques (no laser stimulation) • Both methods involve the same physical processes and so can be analysed in a similar manner • BRET cannot be used in microscopy-based techniques such as FRAP or FLIP, or FACS-based analysis
Construction of Fusion Proteins • The gene of interest is fused to both luciferase (donor) and GFP (acceptor) in two separate vectors • A positive control is used to determine maximal BRET
e.g. B7-1 BRET B7-1luc B7-1YFP substrate YFP luc hu2 (530 nm) hu1 (470 nm) B7-1luc:B7-1YFP B7-1luc CTLA-4luc:CTLA-4YFP B7-1luc:CTLA-4YFP
e.g. BRET on B7 family • Energy transfer can occur solely by random interactions
Comparison to T cell surface molecules with known oligomerisation status! Strong dimers Weak dimer Monomers
Ligand binding causes specific increase in dimerisation • Specific ligand engagement can be observed when receptor is presented in solution or cell-surface bound
Measure Quantitative Properties SPR (BIAcore) AUC ITC (microcalorimetry) Surface Plasmon Resonance Analytical Ultracentrifugation Isothermal Calorimetry
Advantages of SPR on the BIAcore • No labelling is necessary • Real-time analysis allows equilibrium binding levels to be measured even with extremely rapid off-rate. • Small volumes allow efficient use of protein. Important when very high concentrations are required. • No wash steps => weak interactions OK • All types of binding data obtained – including kinetics as its real-time.
Principle of Surface Plasmon Resonance Dip in light intensity Angle of ‘dip’ affected by: 1) Wavelength of light 2) Temperature 3) Refractive index n2
Immobilisation Direct: Indirect: • 2 Main options: • Direct: • Covalently bind your molecule to the chip • Indirect: • First immobilise something that binds your molecule • with high affinity e.g. streptavidin / antibodies
“Specific” Binding Specific response in red flowcell Response in control / empty flowcell due to viscosity of protein solution injected – therefore ‘control’ response DOES increase with concentration (this is NOT binding!!) Measured response Is it specific? • Each chip has four ‘flow-cells’ • Immobilise different molecules in each flow-cell • Must have a ‘control’ flowcell • ‘Specific binding’ is the response in flow-cell of interest minus response in the control flowcell
Equilibrium Binding Analysis Scatchard plot: rearrangement of binding isotherm to give a linear plot. Not so good for calculating Kd, as gives undue weight to least reliable points (low concentration) Plot Bound/Free against Bound Gradient = 1/Kd Binding curve can be fitted with a Langmuir binding isotherm (assuming a 1:1 binding with a single affinity)
Kinetics Harder Case: 2B4 binding CD48
Potential pitfalls • Protein Problems: Aggregates (common) Concentration errorsArtefacts of construct (eg Fc linked) • Importance of controls: Bulk refractive index issues Control analyte Different levels of immobilisation Use both orientations (if pos.) • Mass Transport: Rate of binding limited by rate of injection: kon will be underestimated • Rebinding: Analyte rebinds before leaving chip koff will be underestimated • Last two can be spotted if measured kon and koff vary with immobilisation level (hence importance of controls)
Less common applications van’t Hoff analysis: Gradient Intercept 1. Temperature dependence of binding
Less common applications 1. Temperature dependence of binding Non-linear van’t Hoff analysis:
Less common applications Q30R Q40K R87A 2. Combination with mutagenesis Binding of CD2 by CD48 mutants at 25°C (WT Kd = 40mM) Reduce / abolish binding Do not affect binding Not tested
Less common applications 3. Estimation of valency
Less common applications 4. Screening Newer BIAcore machines are capable of high throughput injection. With target immobilised, many potential partners / drugs can be tested for binding. 5. Identification of unknown ligands Mixtures e.g. cell lysates, tcs, food samples etc. can be injected over a target and bound molecules can then be eluted into tandem mass spectroscopy for identification.
One last warning: take care What a lot of people would have used (straight out of the freezer) Correct result CD48 binding to immobilised CD2 (van der Merwe et al.)
Theory: The Svedberg equation • Consider a particle m in a centrifuge tube filled with a liquid. • The particle (m) is acted on by three forces: • FC: the centrifugal force • FB: the buoyant force (Archimedes principle) • Ff: the frictional force between the particle and the liquid • Will reach constant velocity where forces balance:
Theory: The Svedberg equation • Define s, the sedimentation coefficient: s = • s is a constant for a given particle/solvent, has units of seconds, but use Svedberg (S) units (10–13 s). • Cytochrome c has s=1S, ribosome s=70S, composed of 50S and 30S subunits (sdoes not vary linearly with Mr) • Values for most biomolecules between 1 and 10000 S
Theory: The Svedberg equation S = D = diffusion coefficient, N = Avogadro’s number or (Because Mr = Nm0) • Therefore can directly determine Mr in solution by measuring physical properties of the particle (s and v) under known experimental conditions (D, T and r), • c.f. PAGE, chromatography – comparative & non-native