Agricultural Phosphorus and Eutrophication
200 likes | 501 Views
Agricultural Phosphorus and Eutrophication. by Don Pitts Agricultural Engineer & Water Quality Specialist USDA, NRCS Champaign, IL. Phosphorus (P). Is an essential element for plant growth

Agricultural Phosphorus and Eutrophication
E N D
Presentation Transcript
Agricultural Phosphorus and Eutrophication by Don Pitts Agricultural Engineer & Water Quality Specialist USDA, NRCS Champaign, IL
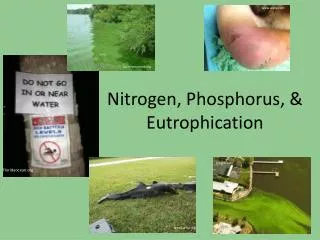
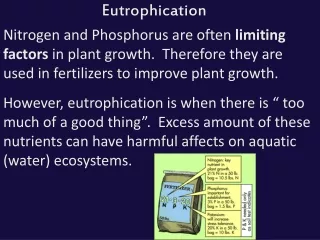
Phosphorus (P) • Is an essential element for plant growth • Additions of fertilizer P inputs have been long recognized as necessary for profitable crop production • Phosphorus inputs can also increase biological productivity of surface waters and cause eutrophication
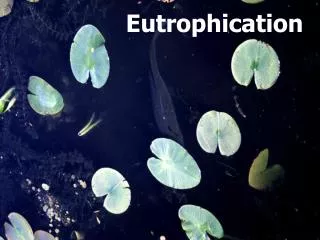
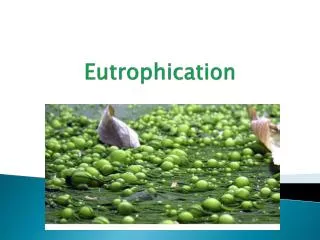
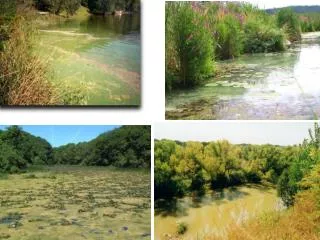
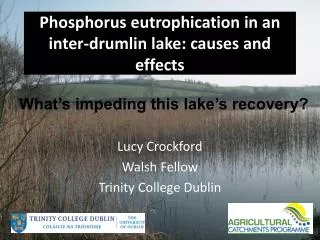
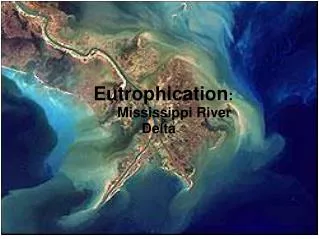
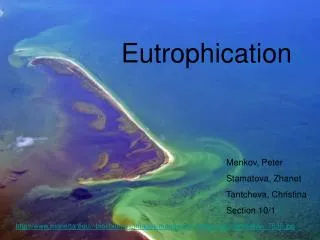
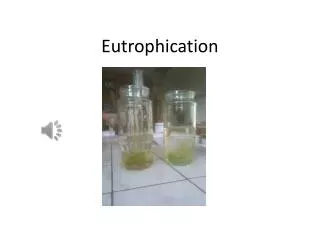
What is Eutrophication? • It is the loading of dissolved and particulate matter to a water body at rates sufficient to produce high biological production • It has been identified as the main cause of impaired surface water in the U.S. (USEPA) (36 Percent of Illinois Lakes are classified as hyper-eutrophic, IEPA, 1999)
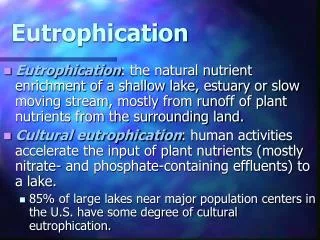
Eutrophication • Eutrophication is the natural aging process of lakes brought on by nutrient enrichment • Eutrophication is generally accelerated by Phosphorus (P) inputs Source: USDA (Sharpley et al., 1999)
Primary Nutrient Inputs for Aquatic Biota Growth Since C and N can be obtained from the atmosphere, P is generally considered the limiting input in fresh water systems.
(assuming sunlight and temperature not limiting) 100 10 Lake Productivity (Chlorophyll a, ppm) Hyper-eutrophic 1 Eutrophic Mesotrophic Oligotrophic 0.1 0.001 0.1 1.0 0.01 P concentration (mg/l) (source: Sharpley, 1997) Relationship Between P and Chlorophyll-a in Fresh Water Systems
Phosphorus (P) Water Quality Standards and Criteria • Total P in streams entering a lake should be less than 0.05 mg/l (Illinois Water Quality Standard) • Ambient Water Quality Criteria Recommendations for Central Illinois Ecoregion, Total P = 0.02 mg/l (USEPA, 2000) • IEPA criteria for streams and rivers is in development
Phosphorus (P) • Sediment-bound or Particle P • it is generally thought that most of the P losses from cropland is in this form (however, in many cases, this may not be true) • Dissolved or Soluble P • is defined as P that will pass through a 0.45 micro filter (sometimes equated to orthophosphate) • is very bio-reactive and available for algae production • Total P = Particle P + Dissolved P
Several Common Myths about Phosphorus Transport • Soils are infinite sinks for P • P does not move through the soil • Erosion control will stop P losses in runoff
Soils are not Infinite Sinks for P • Research has shown that soils cannot indefinitely fix applied P • Continued application of P beyond crop requirements will eventually result in soil P saturation
Long-Term Build-up of Soil P from Continual Over-application From Barber, 1979
Dissolved P in Runoff verses Soil P Level Source: Sharpley et al. (1999) and Hoeft (2000)
Phosphorus Does Move Through the Soil • P may move through the soil given: • low soil P-fixing capacity • high percolation potential (macro pores) • high soil test P
Dissolved Phosphorus in Tile Water verses Soil P Levels Source: Heckrath et al. (1995) Olsen convert to Bray for tile flow P
Erosion Control May Not Stop P Losses in Runoff • Erosion control measures may not reduce dissolved P level in runoff: • high soil test P levels may cause significant dissolved P losses • stratified P (concentrated near the surface) may cause high dissolved P runoff levels
Dissolved P in Runoff verses Soil P Level Source: Hoeft (2000)
Illinois Soil Test Laboratory Reports • A survey of agricultural soil test laboratories in Illinois indicated 64% of the soil samples analyzed had high to very high Soil P levels (Fixen, 1998)
Once elevated, it may take many years of no P fertilizer application to bring soil tests P to normal levels • It was estimated to take 16 - 18 years of corn/soybean production to drop a Portsmouth fine sandy loam from 100 ppm to the agronomic threshold of 20 ppm (McCollum, 1991).
Phosphorus (TP) Concentrations in Surface Water in Illinois (Source: IEPA)
USDA ARS Bulletin 149 http://www.ars.usda.gov/is/np/Phos%26Eutro/phos%26eutrointro.htm Available online