Immune profiling with high-throughput sequencing
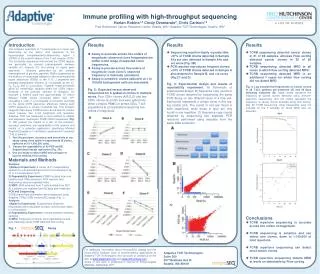
Immune profiling with high-throughput sequencing Harlan Robins 1,2 Cindy Desmarais 2 , Chris Carlson 1,2 Fred Hutchinson Cancer Research Center, Seattle, WA 1 , Adaptive TCR Technologies, Seattle, WA 2. Results

Immune profiling with high-throughput sequencing
E N D
Presentation Transcript
Immune profiling with high-throughput sequencing Harlan Robins1,2Cindy Desmarais2, Chris Carlson1,2 Fred Hutchinson Cancer Research Center, Seattle, WA1, Adaptive TCR Technologies, Seattle, WA2 • Results • Assay is accurate across five-orders of magnitude: observed clone frequencies are within 3-fold range of expected clone frequencies. • Assay is precise across five-orders of magnitude: each clone’s observed frequency is internally consistent. • Assay is sensitive: clones spiked-in at 1 in 100,000 background cells are detectable. • Fig. 2: Expected versus observed frequencies for 6 spiked-in clones in multiple mixes. Four CD4+ clones (A,B,C,D) and two CD8+ clones (E and F) and were spiked into either complex PBMC or sorted CD4+ T cell populations at concentrations spanning five orders of magnitude. • Results • Sequencing reaction highly reproducible: >97% of TCRB chains detected in Sample A1a are also detected in Sample A1b and vis versa (Fig. 3B) • PCR reaction reproduces frequent clones: >54% of TCRB chains detected in Sample A also detected in Sample B, and vis versa (Fig.3C and D) • Fig. 3: Experimental design and results of repeatability experiment. A) Schematic of experimental design. B) Sequence copy counts of TCRB clones obtained by sequencing the same PCR library on two different lanes of a flow cell. Each point represents a unique clone in this log-log scatter plot. The points in red are found in both repetitions, while those in blue are only found in one repetition. C) Sequence copy counts obtained by sequencing two separate PCR reactions performed using template from the same DNA extraction. • Results • TCRB sequencing detected cancer clones in 21 of 28 samples, whereas Flow sorting detected cancer clones in 28 of 28 samples. • TCRB sequencing detected MRD in all cases in which flow sorting detected MRD. • TCRB sequencing detected MRD in an additional 7 cases for which flow sorting did not detect MRD. • Fig. 4: Log transformed frequencies of Cancer clones in 28 T-ALL patients pre-treatment (A) and 29 days following treatment (B). Black circles represent the frequency of cancer clones detected using immune-repertoire sequencing, and red circles represent the frequency of cancer clones detected using flow sorting. Day 29 TCRB sequencing clone frequencies were not included for the 7 samples for which MRD was not detected at Day 0. • Conclusions • TCRB repertoire sequencing is accurate across five orders of magnitude. • TCRB sequencing is sensitive and can detect rare clones, down to 1:100.000 of total repertoire. • TCRB repertoire sequencing can detect most cancer clones. • TCRB repertoire sequencing detects MRD at levels un-detectable by Flow sorting. Introduction The antigenic specificity of T lymphocytes is in large part determined by the amino acid sequence in the hypervariablecomplementarity-determining region 3 (CDR3) of the α and β chains of the T cell receptor (TCR). The nucleotide sequences that encode the CDR3 regions are generated by somatic rearrangement between variable (V), diversity (D), and joining (J) region gene segments. Diversity generated by the somatic rearrangement of germline genomic DNA is augmented by the deletion of nucleotides adjacent to the recombinational signal sequences (RSSs) of the V, D, J segments and template-independent insertion of nucleotides at the Vβ-Dβ, Dβ-Jβ, and Vβ-Jβjunctions. Together, these processes allow for tremendous variation within the CDR3 region. Because of the potential diversity of receptors, for example a healthy adult has approximately 10 million different TCRB chains contained within their 1012 circulating T cells, it is improbable to randomly converge on the same CDR3 sequence, effectively making each CDR3 sequence a unique nucleotide tag. This property suggests that unique TCRB chains can be used to monitor blood cancers, like T-cell lymphoma and leukemia. Adaptive TCR has developed a novel method to amplify and sequence rearranged TCRB CDR3 sequences (Fig. 1). We present the results of a test of the precision, accuracy, sensitivity, and repeatability of this reaction and results of a potential application, identifying Minimal Residual Disease in T cell Acute Lymphoblastic Leukemia (T-ALL) patients. Test the precision, accuracy, and sensitivity of our assay using clone spike-in experiments (6 clones, spiked in at 10-1,000,000 cells). Assess the repeatability of A) PCR and B) Sequencing through replication (Fig. 3A). Use our assay to detect MRD and compare to current method, flow sorting Materials and Methods Samples: 1)Spike-in Experiment: 6 clones (A-F) independently spiked into a diverse background at 3 concentrations (A-D) or 4 concentrations (E-F). 2) Repeatability Experiment: PBMC isolated from one healthy adult. DNA extraction, PCR reaction, and Sequencing reaction repeated twice. 3) MRD: DNA extracted from T cells isolated form 28 T-ALL patients pre-treatment and 29 days after treatment. PCR and Sequencing: TCRB chains from all samples were sequenced using Adaptive TCRs TCRB immunoSEQ assay (Fig. 1). Analysis: 1)Spike-in Experiment: Expected and observed frequencies were calculated for each clone at each spike-in concentration. 2) Repeatability Experiment: Overlap between repeated samples. 3) MRD: Frequency of cancer clone calculated pre and post-treatment using TCRB SEQ and flow sorting. Fig. 1: Assay For additional information about immunoSEQ assays and the immunoSEQ Analyzer suite of bioninformatics applications at Adaptive TCR Technologies, visit our booth or contact us on the web at www.adaptivetcr.com and www.immunoseq.com. Some of this work is published in Journal of Immunological Methods, September 2011. Adaptive TCR Technologies Suite 300 307 Westlake Ave N Seattle, WA 98109