Download

1 / 34
340 likes | 517 Views
Coordinating Capacity and Inventory in Supply Chains with High-Value Products. Murat Erkoc Associate Professor and Director UM Center for Advanced Supply Chain Management Department of Industrial Engineering University of Miami Coral Gables, Florida. E-mail: merkoc@miami.edu.

E N D
Coordinating Capacity and Inventory in Supply Chains with High-Value Products Murat Erkoc Associate Professor and Director UM Center for Advanced Supply Chain Management Department of Industrial Engineering University of Miami Coral Gables, Florida. E-mail: merkoc@miami.edu
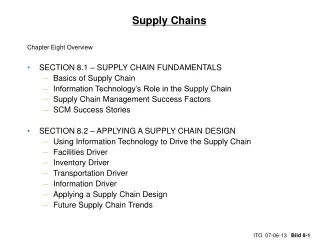
Matching Demand and Supply • Two types of costs occur if supply and demand do not match • Supply < Demand => opportunity cost • Supply > Demand => Inventory cost • To match the two • Manage Supply • Capacity management • Inventory management • Manage Demand • Marketing/pricing
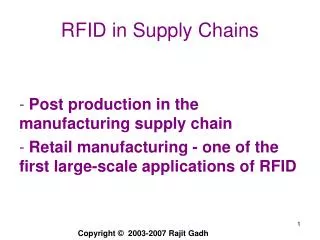
High-Tech Manufacturing Supply Chain • Rapid innovation & volatile demand • High obsolescence rate on technology • Short product life-cycle • Capital intensive facilities ($2 Billion +) • High capacity costs • Manufacturers are conservative in capacity expansion of any form Capacity reservation contracts
High-Tech Supply Chain Building Blocks Capacity Reservation Contract Buyer1 CM 1 Supplier 1 Buyer2 Supplier 2 CM 2 BuyerM CM n Supplier K Contract Manufacturers Spot Market
F(x) p w Market Supplier Buyer c V(k) Integrated Channel expected sales given capacity k
Delegation of Control in the Supply Chain • System’s Profit (concave) • Let kobe the system optimal solution • Supplier’s newsvendor profit function • Let k*be the newsvendor solution
F(x) p w Market Supplier Buyer c V(k) Double Marginalization- suboptimal • Due to double marginalization the system optimal capacity is always greater than the supplier’s newsvendor capacity Optimal Competitive Outcome
Reservation Contract with Deductible Fee • For each unit of capacity reserved, the buyer is charged a fee • The fee is later deducted from the purchasing price if the reserved capacity is used by the intended customer • If the buyer’s demand exceeds the reservation amount, the orders are satisfied based on the availability of “extra capacity” • Customer reservations are locked in and some extra capacity may be built during expansion • The wholesale price w and product cost c are set at the “design-win” phase, which are not negotiable
The Sequence of Events Supplier announces reservation fee (r) Buyer announces how much to reserve (q) Supplier decides how much capacity to build (k) Demand is realized (x) Buyer is penalized for unused reserved capacity
Supplier’s Capacity Decision If , then the constraint must be binding
Buyer’s Incentive to Reserve • Buyer never reserves less than k*. In fact, she reserves only if the reservation fee is below a certain threshold, rt. The reservation quantity will be at least qt , where • qtis a function ofwand does not depend on p • The buyer reserves iff r rt Threshold Reservation Qty. Threshold fee
The Supplier’s Faces Three Profit Scenarios in sequence as the Buyer’s Margin Decreases Theorem: It is individually rational for the supplier and the buyer to enter the reservation contract if the buyer revenue margin p is no less than the threshold pt as follows: Expected Profit Expected Profit r* r r min min Reservation Fee Reservation Fee Scenario 1: High Scenario 2: Medium Expected Profit r min Reservation Fee Scenario 3: Low The buyer’s margin must be sufficiently high to justify capacity reservation
System Optimality and Reservations • Capacity reservation may create surplus for the channel • However, except for a few special cases the surplus is sub-optimal • We design two additional coordination mechanisms to achieve optimality • Partial-deduction (PD) contract • Cost-sharing (Options) contract
Subcon Supplier Customer Subcon Supply Demand Buffer Inventory Management with Horizontal Model
Optimization Model Identify best method of distribution and demand management for outsource models. EchelonVis. To CM WIP & Dmd 4 3 Demand Mgmt 1 2 Installation Central Regional Distribution Method
Scenarios • Central: inventory is staged at central supplier location. • Regional: inventory is staged at customer regional locations • Installation: legacy information policy – only CM forecast and orders shared with supplier. • Echelon: collaborative information policy – CM WIP, inventory and end customer demand on CM shared with supplier. EchelonVis. To CM WIP & Dmd EC ER Demand Mgmt IC IR Installation Central Regional Distribution Method
No No Forecast Forecast Visibility Visibility Installation Installation Regional Regional Shipments Shipments Supplier Supplier Regional Hubs Regional Hubs Sub Sub - - Con Con End Customer End Customer Installation Installation Central Central End Customer End Customer Supplier Supplier Sub Sub - - Con Con Installation Policies (No visibility)
Forecast Forecast Echelon Echelon Regional Regional Shipments Shipments Supplier Supplier Regional Hubs Regional Hubs Sub Sub - - Con Con End Customer End Customer Echelon Echelon Central Central WIP & Inventory WIP & Inventory End Customer End Customer Supplier Supplier Sub Sub - - Con Con Echelon Policies Visibility on Sub-Con WIP and FGI
Objectives Performance Measures • Identify the business model that leads to • Higher profits • Higher service levels for the end customer • Lower inventory costs • Higher inventory turnover/velocity • Find scenarios that lead to desirable performance combinations • Investigate the advantages and drawbacks of each model under different parameter settings and demand structures
Part 1: Decision Making Part 2: Performance Evaluation (Test Bed) Input IC IC Parameters IR IR EC Scenarios EC ER ER Approach • Create an Excel Spreadsheet model to simulate the supply chain for the 4 scenarios
Scenario Parameters • Demand forecast refreshed weekly or daily • Sub-con shares • Demand volatility (% of forecasted demand) • Manufacturing lead times for all facilities • Assumed 1-2 weeks at subcontractors • Delivery Performance • Transportation lead times • Cost Parameters • Manufacturing cost • Inventory cost • Transportation cost • Selling price
Results Screen • Red row:highest profit • Blue row:lowest inventory cost
Examples • Demand forecast across two quarters from end customer 1(Example 1) and end customer 2 (Example 2) • Example 1 (Device Code) • 10 weeks of manufacturing lead time • Weekly review • Two volatility scenarios (30% & 80%) • Two CM’s with 40-60 split • No transportation delay • Example 2 (Device Code) • 41 days of manufacturing lead time • Daily review • 65% volatility • Two CM’s with no obvious pattern in split • 3 days of transportation lead time to the CM location
Policy Comparisons • Higher profits with echelon and central warehousing policies • More than 35% improvement in inventory cost under echelon policy • No significant advantage of central warehousing in inventory cost • Higher profits with echelon and central warehousing policies • Around 50% improvement in inventory cost under echelon policy • 10% to 20% improvement in inventory cost under central warehousing
Inventory Velocity (annual sales/average inventory) • 30-50% improvement in overall inventory velocity with echelon policy • FG inventory velocity increases more than 3 fold with echelon policy • 15-20% improvement in overall inventory velocity with echelon policy • FG inventory velocity increases around 5 fold with central warehousing
Inventory Velocity • More sensitive to demand management • More sensitive to distribution method
Test Bed & Sensitivity to Subcon Split Changes • Optimal policies from each model are plugged in the “Test Bed” • Test bed is used to analyze the sensitivity of the business strategies to subcon split changes • The model investigates different scenarios by fluctuating subcon shares in demand
Impact of Split Changes on Inventory Cost • EC policy is less sensitive to split changes (< 3%) • Increase can be as high as 11% in IC policy
Conclusions • Modeling allows for rapid identification and subsequent optimization of the dominant drivers for device-specific and customer-specific supply chains • Both demand management and distribution policy have significant impact on the supply chain performance • Demand and manufacturing profiles have dramatic effect on how models perform • With high subcontractor share volatility, highest advantage is gained by moving to central warehousing • With greater demand stability and subcontractor share certainty, highest advantage is gained from moving to echelon policy
University of Miami Ryder IBM ABOUT UM CASCM • Focus on analytical and computational research, education and training • Membership based • Housed in the College of Engineering with contributions from other Colleges • Industrial Engineering • School of Business • School of Law • Inter-American Sponsor Program Murat Erkoc, Ph.D., Director of CASCM E-mail: merkoc@miami.edu Tel: 305 284 4477 Fax: 305 284 4040
CASCM Sample Projects • Joint optimization of inventory and scheduling for exchange programs in MRO operations • Optimal network flow design for a 3PL • Efficient contract/bid design for a logistics company • Optimal replenishment policies for food and beverage items in cruse lines