Download
1 / 16
160 likes | 291 Views
The Blackboard Grade Center is an interactive tool for recording student grades and monitoring progress. It facilitates communication among students, parents, and administrators, aiding in informed decision-making to enhance student success. Various items like assignments and tests automatically create grade columns. Instructors can organize the Grade Center through the Action Bar, create calculated columns for average, minimum, and total grades, and seamlessly manage course performance data. Explore how to effectively utilize this essential feature for educational advancement.

E N D
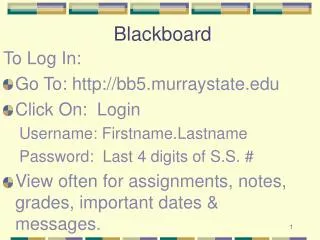
Blackboard 9.1 Designer & Developer Orientation
The Grade Center Introduction The Blackboard Grade Center is more than just a way to record students’ grades; it is a dynamic and interactive tool. The Grade Center can record data, monitor student progress, communicate information to students, parents, administrators, and other stakeholders. It is also a valuable tool to assist in making informed decisions to take action to promote student and organizational progress. Assignments, Tests, Blogs, Journals, Wikis, and Discussion Board items that are set to be evaluated automatically generate a Column in the Grade Center. Items that have a due date are assigned a Grade Set automatically based on that date. Instructors access the Full Grade Center from the Grade Center section of the Control Panel. The default Smart Views appear in an indented list under Full Graded Center.
The Grade Center General Information about the Grade Center The Grade Center is organized around a main page that resembles a spreadsheet. Each row is populated by a user in the Course and each column is made up of Assignments, Tests, and other items that can be evaluated. Columns can also be used for calculating results. Grades and comments are added directly on the Grade Center main page, the Grade Details page (where more information can be added), and evaluation pages that can be accessed directly from the Tools, such as the Discussion Board or Journals. Use the scroll bar to scroll through all the items in the Grade Center
The Grade Center When Setting up and organizing your class’s grade center you need to use the Action Bar on top of the page. Lets get into more details on each of the items in the Grade Center’s Action Bar. • Create Column • Items that are added to Course Content such as an assignment or test automatically generate a column in the Grade Center. Items that are not added from Course Content need to have a column created manually in the Grade Center. Instructors can manually create Tests, Quizzes, and Class Participation columns, for example. The Create Column link is used to create a column in the Grade Center. • Learn more aboutCreating Columns • Watch Video
The Grade Center • Create Calculated Column • In the Grade Center, an Instructor can calculate grades by combining multiple columns to attain performance results, such as class averages, final results that are based on a weighted scale, or total points. These are called Calculated Columns. • Average Column: • An Average column displays the average for any number of quantities. An Average Column can include any the following non-text columns: • All Grade Columns: All individual Result columns added to the Results Center. • All Grade Columns in a Grading Period: All Grade columns that have been added to a Grading Period • Selected Columns and Categories: Any Grade columns and any or all Categories. • For example, an Instructor can display the average for all Tests, or display the average grade for each Student for an evaluation period. Any Columns with Text as the primary display cannot be averaged. Any Categories that contain items that are set to No for the Include in Grade Center calculations setting will ignore those items when figuring the Average Result. • Learn more about Creating an Average Column
The Grade Center • Minimum/Maximum Column: • A Minimum or Maximum Grade column displays either the minimum or maximum grade for a selection of Columns. This column is displayed to the Students or just the Instructor. • In creating a Minimum/Maximum Grade column, the Instructor can select from the following: • All Grade Columns: All individual Grade Columns added to the Grade Center. • Grade Columns in a Grading Period: All Grade Columns that have been added to a Grading Period • Selected Evaluable Columns and Categories: Any Grade Columns and any or all Categories. • Learn more about Creating a Minimum/Maximum Column
The Grade Center • Total Column: • A Grade Center Total Column is a result based on the cumulative points received, related to the points allowed. • The following items are selected to create a Total Points calculation and its column: • All Grade Columns: All individual Grade Columns added to the Grade Center. • Grade Columns in a Grading Period: All Grade Columns that have been added to a Grading Period. • Selected Evaluable Columns and Categories: Any Grade Columns and any or all Categories. • For example, an Instructor may create a column to determine the final grade for the first quarter by creating a Grade Center Total Points column that includes all of the columns in the first quarter Grading Period. Alternatively, an Instructor can create a Grade Center Total Points column that displays the percentages of a particular Grade Center column, or a Category or Categories. Any Grade Columns with text as the primary display cannot be used in the Total Points calculation. • Learn more about Creating a Total Column
The Grade Center • Weighted Column: • A Weighted Grade is a Calculated Column that displays the calculated grade of quantities and their respective percentages. A Weighted Grade is displayed as a column in the Grade Center. Instructors control the visibility of the column in the Results Center as well as controlling the release of the column to students and other users. • For example, an Instructor may create a Weighted Grade column that calculates a quarterly grade (grade for one quarter of the year), in which each Category, such as Test, Survey, and Exercise are given a certain percentage of the final quarter's grade. Alternatively, the Instructor may create a Weighted Grade that is the final grade for a course, with the quarters and exams included in the Weighted Grade. • Instructors can create any number of Weighted Grade columns, including Weighted Grade columns that include other Weighted Grade columns. For example: • (Quiz = 20%) + (Homework = 10%) + (Participation = 20%) + (Exam = 50%) = (Quarter Result) • (Quarter 1 = 25%) + (Quarter 2 = 25%) + (Quarter 3 = 25%) + (Quarter 4 = 25%) = (Year Result)
The Grade Center • Instructors can create a Weighted Grade based on any column, or any Category in the Grade Center. Any Grade Center columns with text as the primary display cannot be used in the Weighted Result calculation. • Simple Weighted Grade Workflow: • The following diagram displays the workflow for creating a Weighted Grade Column based on four (4) columns: • Mid-term Exam = 20% • Final Exam = 30% • Exercises Category = 25% • Quizzes Category = 25% • Learn more about Creating a Weighted Column • To create these Calculated Columns you need to know how to select columns and categories: • Learn more about Selecting Columns and Categories • Learn more about Selecting Columns and Categories for Weighted Grades
The Grade Center • Manage • This link provides access to the drop-down list with options for further managing the Grade Center. • Grading Periods: Grading Periods are user created segments that can help manage the Grade Center. Grading Periods, for example, can be defined as Terms, Semesters, Quarters, Years, and so on, and can have date ranges that further define them. Grading Periods are not created by default. If desired, they must be defined by Instructors. • Note: Grade Center items cannot be associated with more than one Grading Period. A newly created Grading Period with the same or an overlapping date range will override the settings of an existing Grading Period. All items associated with the existing Grading Period will become associated with the new one. • Learn more about Creating Grading Period
The Grade Center • Grading Schemas: Grading schemas map percent scores to letter grades or some other notation for reporting performance. • Learn more about Creating a Grading Schema • Grading Color Codes: Grading Color Codes apply background and text color to items in the Grade Center that meet specified criteria. Colors can be defined for items based on Grade status or based on the score. • Learn more about Creating Grading Color Codes • Watch Video
The Grade Center • Categories: A Grade Center Category is a classification of Grade Center Columns. Categories are used to organize and view Grade Center data and can be used when creating Calculated Columns to perform operations on all Grade Columns in a Category. The Grade Center has nine default Categories: Assignment, Blog, Discussion, Journal, Safe Assignment, Self and Peer, Survey, and Test that cannot be removed or edited. • Learn more about Creating Categories • Watch Video
The Grade Center • Smart Views: Smart Views are focused views of the Grade Center. Any number of Smart Views can be created based on a variety of criteria, including Grading Periods, Categories, and Performance. • In the Grade Center section of the Control Panel, favorite Smart Views appear in alphabetical order as an indented list under Full Grade Center. • In a new course, the Assignments and Tests Smart Views appear in the list by default. When you click Assignments, the Grade Center page opens and only assignment columns appear in the grid. When you click Full Grade Center, all the columns appear in the grid. • Learn more about Creating Smart Views • Watch Video
The Grade Center • Column Organization: Freeze and unfreeze columns, change the order of columns, grading periods and categories. • Learn more about the Column Organization Page • Watch Video • Row visibility: Determine weather or not a student’s record is visible. • Learn more about Hiding/Showing Row(s) in Grade Center • Send Email: send email to multiple or individual students from the Grade Center. • Learn more about Sending Email from the Grade Center
The Grade Center Reports Reports are customized, printable Reports from Grade Center data designed to be shared with Students and Observers. Reports can be generated for all of the grades in the Grade Center, for a specific time frame such as a marking period, for a defined group of Students, or for a defined Category of grades. Reports are read-only. Reports are set to print details for one user per page. Learn more about Creating Grade Center Reports Watch Video Learn more about View Grade History
The End Thanks for participating in this tutorial.