Chapter 12
Chapter 12. Section 12.0 Review of Linear Inequalities. 6. 6. 6. 6. 5. 5. 5. 5. 4. 4. 4. 4. 3. 3. 3. 3. 2. 2. 2. 2. 1. 1. 1. 1. -6. -6. -6. -6. -5. -5. -5. -5. -4. -4. -4. -4. -3. -3. -3. -3. -2. -2. -2. -2. -1. -1. -1. -1. 1. 1. 1. 1. 2. 2.

Chapter 12
E N D
Presentation Transcript
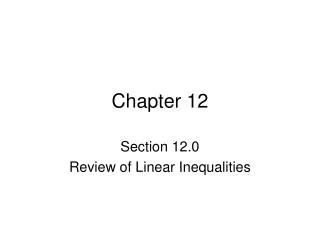
Chapter 12 Section 12.0 Review of Linear Inequalities
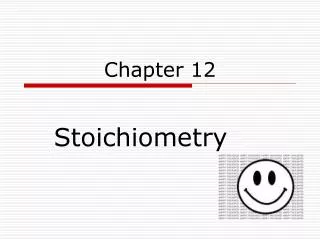
6 6 6 6 5 5 5 5 4 4 4 4 3 3 3 3 2 2 2 2 1 1 1 1 -6 -6 -6 -6 -5 -5 -5 -5 -4 -4 -4 -4 -3 -3 -3 -3 -2 -2 -2 -2 -1 -1 -1 -1 1 1 1 1 2 2 2 2 3 3 3 3 4 4 4 4 5 5 5 5 6 6 6 6 -1 -1 -1 -1 -2 -2 -2 -2 -3 -3 -3 -3 -4 -4 -4 -4 -5 -5 -5 -5 -6 -6 -6 -6 Describing Shapes It is useful and more precise to use equations or inequalities to describe shapes. You most often like to draw a picture them though to help understand the details of the shape. Graphing a Linear Inequality Some examples of linear inequalities are seen to the right. They all use the symbols of either <, >, <, or >. Their graphs are always one half of the plane either the above or below a line or left or right of a line. The line is either solid or dashed. The graphs represent the points that are solutions to the inequality. Graphing Inequalities that have only one variable means you are looking at a region that has either a vertical (if only x is used) or horizontal (if only y is used) boundary. x > -4 x< 3 y> 1 y < -3 y = 1 y = -3 x = -4 x = 3
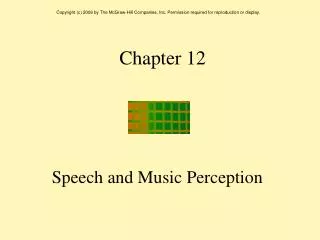
6 6 5 5 4 4 3 3 2 2 1 1 -6 -6 -5 -5 -4 -4 -3 -3 -2 -2 -1 -1 1 1 2 2 3 3 4 4 5 5 6 6 -1 -1 -2 -2 -3 -3 -4 -4 -5 -5 -6 -6 Graphing Linear Inequalities To graph a linear inequality that involves both x and y we do the following: 1. Solve the inequality for y. (Important if you need to multiply or divide by a negative you need to reverse the direction the inequality points!) 2. Treat it as if it were a line graphing it with either a solid or dashed line. 3. If it is > or > shade above the line. If it is < or < shade below the line. Graph: y < -3x + 4 Graph: 4x – 2y< 6 Solve This inequality is already solved for y. We do not need to do this step. Divide by -2. Reverse < to >. y = -3x + 4 Shade what is above the line. y = 2x - 3 Shade what is Below the line.
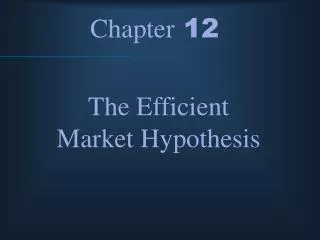
6 5 4 3 2 1 -6 -5 -4 -3 -2 -1 1 2 3 4 5 6 -1 -2 -3 -4 -5 -6 Graphing Systems of Linear Inequalities A system of linear inequalities are several of linear inequalities all graphed on the same graph. The region where they all overlap is called the solution to the system or the feasible solution. The feasible solution will describe a shape. To solve the system of inequalities above we do the following: 1. Graph each inequality putting arrows on the correct side of the line instead of shading. 2. Shade in the region they will all overlap. 3. Located the points where the lines cross by using either substitution or elimination methods for intersecting lines Solve the inequality y< -2x+6 To find Point D To find Point C x = 0 B D y = 4 The points A, B, C and D are called Corner Points. A C Point A is (0,0) Point B is (0,4) Point C is (3,0) Point D is (1,4) y = 0 y=-2x+6
6 5 4 3 2 1 -1 1 2 3 4 5 6 -1 Very often it is practical to have x and y not be negative and you get the inequalities x>0 and y>0 in the system of inequalities. Find the feasible solution to the system below. Solve Solve Objective Functions An objective function is a formula with x and y. We want to be able to evaluate an objective function at all of the corner points of the feasible solution. x = 0 Objective Function: (0,5) (0,0) y = 0