Download
1 / 56
560 likes | 691 Views
V9 From Protein Complexes to Networks and back. Protein interaction could be defined in a number of ways (1) Proteins that form permanent supracomplexes = „protein machines“ (2) Proteins that bind each other transiently (signal transduction, bioenergetics ... )

E N D
V9 From Protein Complexes to Networks and back Protein interaction could be defined in a number of ways (1) Proteins that form permanent supracomplexes = „protein machines“ (2) Proteins that bind each other transiently (signal transduction, bioenergetics ... ) (3) Co-regulated expression of genes/proteins (4) Proteins participating in the same metabolic pathways (5) Proteins sharing substrates (6) Proteins that are co-localized Techniques: Experimental methods + computational methods. Softwarewerkzeuge
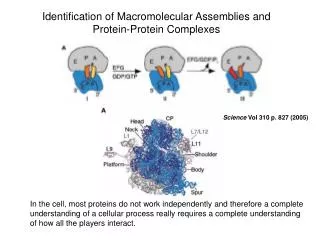
1 Protein-Protein Complexes It has been realized for quite some time that cells don‘t work by random diffusion of proteins, but require a delicate structural organization into large protein complexes. Which complexes do we know? Softwarewerkzeuge
RNA Polymerase II RNA polymerase II is the central enzyme of gene expression and synthesizes all messenger RNA in eukaryotes. Cramer et al., Science 288, 640 (2000) Softwarewerkzeuge
RNA processing: splicesome Structure of a cellular editor that "cuts and pastes" the first draft of RNA straight after it is formed from its DNA template. It has two distinct, unequal halves surrounding a tunnel. The larger part appears to contain proteins and the short segments of RNA, while the smaller half is made up of proteins alone. On one side, the tunnel opens up into a cavity, which the researchers think functions as a holding space for the fragile RNA waiting to be processed in the tunnel itself. Profs. Ruth and Joseph Sperling http://www.weizmann.ac.il/ Softwarewerkzeuge
Protein synthesis: ribosome The ribosome is a complex subcellular particle composed of protein and RNA. It is the site of protein synthesis, http://www.millerandlevine.com/chapter/12/cryo-em.html Model of a ribosome with a newly manufactured protein (multicolored beads) exiting on the right. Softwarewerkzeuge
Signal recognition particle Cotranslational translocation of proteins across or into membranes is a vital process in all kingdoms of life. It requires that the translating ribosome be targeted to the membrane by the signal recognition particle (SRP), an evolutionarily conserved ribonucleoprotein particle. SRP recognizes signal sequences of nascent protein chains emerging from the ribosome. Subsequent binding of SRP leads to a pause in peptide elongation and to the ribosome docking to the membrane-bound SRP receptor. SRP shows 3 main activities in the process of cotranslational targeting: first, it binds to signal sequences emerging from the translating ribosome; second, it pauses peptide elongation; and third, it promotes protein translocation by docking to the membrane-bound SRP receptor and transferring the ribosome nascent chain complex (RNC) to the protein-conducting channel. 40S small ribosomal subunit (yellow) 60S large ribosomal subunit (blue), P-site tRNA (green), SRP (red). Halic et al. Nature 427, 808 (2004) Softwarewerkzeuge
Nuclear Pore Complex A three-dimensional image of the nuclear pore complex (NPC), revealed by electron microscopy. A-B The NPC in yeast. Figure A shows the NPC seen from the cytoplasm while figure B displays a side view. C-D The NPC in vertebrate (Xenopus). http://www.nobel.se/medicine/educational/dna/a/transport/ncp_em1.html Three-Dimensional Architecture of the Isolated Yeast Nuclear Pore Complex: Functional and Evolutionary Implications, Qing Yang, Michael P. Rout and Christopher W. Akey. Molecular Cell, 1:223-234, 1998 NPC is a 50-100 MDa protein assembly that regulates and controls trafficking of macromolecules through the nuclear envelope. Softwarewerkzeuge
GroEL: a chaperone to assist misfolded proteins Schematic Diagram of GroEL Functional States (a) Nonnative polypeptide substrate (wavy black line) binds to an open GroEL ring. (b) ATP binding to GroEL alters its conformation, weakens the binding of substrate, and permits the binding of GroES to the ATP-bound ring. (c) The substrate is released from its binding sites and trapped inside the cavity formed by GroES binding. (d) Following encapsulation, the substrate folds in the cavity and ATP is hydrolysed. (e) After hydrolysis in the upper, GroES-bound ring, ATP and a second nonnative polypeptide bind to the lower ring, discharging ligands from the upper ring and initiating new GroES binding to the lower ring (f) to form a new folding active complex on the lower ring and complete the cycle. http://people.cryst.bbk.ac.uk/~ubcg16z/chaperone.html Ransom et al., Cell 107, 869 (2001) Softwarewerkzeuge
proteasome The proteasome is the central enzyme of non-lysosomal proteindegradation. It is involved in the degradation of misfolded proteins as well as in the degradation and processing of short lived regulatory proteins.The 20S Proteasome degrades completely unfoleded proteins into peptides with a narrow length distribution of 7 to 13 amino acids. http://www.biochem.mpg.de/xray/projects/hubome/images/rpr.gif Löwe, J., Stock, D., Jap, B., Zwickl, P., Baumeister, W. and Huber, R. (1995). Crystal structure of the 20S proteasome from the archaeon T. acidophilum at 3.4 Å resolution. Science268, 533-539. Softwarewerkzeuge
Apoptosome (A) Top view of the apoptosome along the 7-fold symmetry axis. (B) Details of the spoke. (C) A side view of the apoptosome reveals the unusual axial ratio of this particle. The scale bar is 100 Å. (D) An oblique bottom view shows the puckered shape of the particle. The arms are bent at an elbow (see asterisk) located proximal to the hub. Acehan et al. Mol. Cell 9, 423 (2002) Apoptosis is the dominant form of programmed cell death during embryonic development and normal tissue turnover. In addition, apoptosis is upregulated in diseases such as AIDS, and neurodegenerative disorders, while it is downregulated in certain cancers. In apoptosis, death signals are transduced by biochemical pathways to activate caspases, a group of proteases that utilize cysteine at their active sites to cleave specific proteins at aspartate residues. The proteolysis of these critical proteins then initiates cellular events that include chromatin degradation into nucleosomes and organelle destruction. These steps prepare apoptotic cells for phagocytosis and result in the efficient recycling of biochemical resources. In many cases, apoptotic signals are transmitted to mitochondria, which act as integrators of cell death because both effector and regulatory molecules converge at this organelle. Apoptosis mediated by mitochondria requires the release of cytochrome c into the cytosol through a process that may involve the formation of specific pores or rupture of the outer membrane. Cytochrome c binds to Apaf-1 and in the presence of dATP/ATP promotes assembly of the apoptosome. This large protein complex then binds and activates procaspase-9. Softwarewerkzeuge
2 Aim: generate structures of protein complexes • Experiment • Start from 232 purified complexes from Tandem Affinity Purification (TAP) strategy. • Select 102 that gave samples most promising for EM from analysis of gels and protein concentrations. • Take EM images. • Theory • Make list of components. • Assign known structures of individual proteins. • Assign templates of complexes • If complex structure available for this pair • if complex structure available for homologous protein • if complex structure available for structurally similar protein (SCOP) Bettina Böttcher (EM) Rob Russell (Bioinformatics) Softwarewerkzeuge
How transferable are interactions? interaction similariy (iRMSD) vs. % sequence identity for all the available pairs of interacting domains with known 3D structure. Curve shows 80% percentile (i.e. 80% of the data lies below the curve), and points below the line (iRMSD = 10 Å) are similar in interaction. Aloy et al. Science, 303, 2026 (2004) Softwarewerkzeuge
Bioinformatics Strategy Illustration of the methods and concepts used. How predictions are made within complexes (circles) and between them (cross-talk). Bottom right shows two binary interactions combined into a three-component model Aloy et al. Science, 303, 2026 (2004) Softwarewerkzeuge
Successful models of yeast complexes (A) Exosome model on PNPase fit into EM map. (B) RNA polymerase II with RPB4 (green)/RPB7 (red) built on Methanococcus jannaschii equivalents, and SPT5/pol II (cyan) built with IF5A. (C and D) Views of CCT (gold) and phosphoducin 2/VID27 (red) fit into EM map. (E) Micrograph of POP complex, with particle types highlighted. (F) Ski complex built by combination of two complexes. Aloy et al. Science, 303, 2026 (2004) Softwarewerkzeuge
Future? • Structural genomics (X-ray) may soon generate enough templates of individal folds. • Structural genomics may be expanded to protein complexes. • Interactions between proteins of the same fold tend to be similar when the sequence identity is above approximately 30% (Aloy et al.). • Hybrid modelling of X-ray/EM will not be able to answer all questions • problem of induced fit • transient complexes cannot be addressed by these techniques • Essential to combine large variety of hybrid + complementary methods • Russell et al. Curr. Opin. Struct. Biol. 14, 313 (2004) Softwarewerkzeuge
3 Bioinformatic identification of interface patches Statistical analysis of protein-protein interfaces in crystal structures of protein-protein complexes: residues at interfaces have significantly different amino acid composition that the rest of the protein. predict protein-protein interaction sites from local sequence information ? Conservation at protein-protein interfaces: interface regions are more conserved than other regions on the protein surface identify conserved regions on protein surface e.g. from solvent accessibility Patterns in multiple sequence alignments: Interacting residues on two binding partners often show correlated mutations (among different organisms) if being mutated identify correlated mutations Structural patterns: surface patterns of protein-protein interfaces: interface often formed by hydrophobic patch surrounded by ring of polar or charged residues. identify suitable patches on surface if 3D structure is known Softwarewerkzeuge
4 NOXClass: Distinguish Permanent / Transient Complexes Aim: (1) distinguish different types of biological interactions (X-ray structures of protein- protein complexes). (2) develop automatic classification scheme. Zhu, Domingues, Sommer, Lengauer, BMC Bioinformatics 7, 27 (2006), Softwarewerkzeuge
Dataset Softwarewerkzeuge
Interface properties considered Zhu, Domingues, Sommer, Lengauer, BMC Bioinformatics 7, 27 (2006), Softwarewerkzeuge
Distribution of interface area Interface area = Crystal packing contacts have very small interfaces. Obligate interfaces are on average larger than non-obligate interfaces. Zhu, Domingues, Sommer, Lengauer, BMC Bioinformatics 7, 27 (2006), Softwarewerkzeuge
Dataset The distributions of obligate and non-obligate interfaces are quite similar, but very different from crystal packing contacts. Zhu, Domingues, Sommer, Lengauer, BMC Bioinformatics 7, 27 (2006), Softwarewerkzeuge
Hydrophobic residues (FLIV) contribute twice as much to obligate interfaces as to crystal packing contacts. Aromatic residues (FWY) tend to be more abundant in biological interfaces. Zhu, Domingues, Sommer, Lengauer, BMC Bioinformatics 7, 27 (2006), Softwarewerkzeuge
Good Performance Zhu, Domingues, Sommer, Lengauer, BMC Bioinformatics 7, 27 (2006), Softwarewerkzeuge
5 Correlated mutations at interface Pazos, Helmer-Citterich, Ausiello, Valencia J Mol Biol 271, 511 (1997): correlation information is sufficient for selecting the correct structural arrangement of known heterodimers and protein domains because the correlated pairs between the monomers tend to accumulate at the contact interface. Use same idea to identify interacting protein pairs. Softwarewerkzeuge
Correlated mutations at interface Correlated mutations evaluate the similarity in variation patterns between positions in a multiple sequence alignment. Similarity of those variation patterns is thought to be related to compensatory mutations. Calculate for each positions i and jin the sequence a rank correlation coefficient (rij): where the summations run over every possible pair of proteins k and l in the multiple sequence alignment. Siklis the ranked similarity between residue i in protein k and residue i in protein l. Sjkl is the same for residue j. Si and Sj are the means of Sikland Sjkl. Pazos, Valencia, Proteins 47, 219 (2002) Softwarewerkzeuge
i2h method Schematic representation of the i2h method. A: Family alignments are collected for two different proteins, 1 and 2, including corresponding sequences from different species (a, b, c, ). B: A virtual alignment is constructed, concatenating the sequences of the probable orthologous sequences of the two proteins. Correlated mutations are calculated. C: The distributions of the correlation values are recorded. We used 10 correlation levels. The corresponding distributions are represented for the pairs of residues internal to the two proteins (P11 and P22) and for the pairs composed of one residue from each of the two proteins (P12). Pazos, Valencia, Proteins 47, 219 (2002) Softwarewerkzeuge
Predictions from correlated mutations Results obtained by i2h in a set of 14 two domain proteins of known structure = proteins with two interacting domains. Treat the 2 domains as different proteins. A: Interaction index for the 133 pairs with 11 or more sequences in common. The true positive hits are highlighted with filled squares. B: Representation of i2h results, reminiscent of those obtained in the experimental yeast two-hybrid system. The diameter of the black circles is proportional to the interaction index; true pairs are highlighted with gray squares. Empty spaces correspond to those cases in which the i2h system could not be applied, because they contained <11 sequences from different species in common for the two domains. In most cases, i2h scored the correct pair of protein domains above all other possible interactions. Pazos, Valencia, Proteins 47, 219 (2002) Softwarewerkzeuge
6 Coevolutionary Analysis Idea: if co-evolution is relevant, a ligand-receptor pair should occupy related positions in phylogenetic trees. Goh & Cohen, 2002 showed that within correlated phylogenetic trees, the protein pairs that bind have a higher correlation between their phylogenetic distance matrices than other homologs drawn drom the ligand and receptor families that do not bind. Other Idea: analyze occurrence of proteins that can functionally substitute for another in various organisms. Detect analogous enzymes in thiamin biosynthesis Softwarewerkzeuge
Detect analogous enzymes in thiamin biosynthesis Gene names are applied according to the first gene described from a group of orthologs. Solid black arrows represent known or proposed reaction steps and dashed black arrows indicate unknown reactions. In addition, significant anticorrelations in the occurrence of genes across species (red arrows), and relevant in silico predicted protein-protein interactions (blue dashed arrows) are illustrated. Distinct precursors have been proposed for different species (indicated in gray). Genes with orthologous sequences in eukaryotes and prokaryotes are in green; genes assumed to be prokaryote-specific are black. Interestingly, significant 'one-to-one' anticorrelations usually involve a prokaryote-specific and a 'ubiquitous' gene. Abbreviations: AIR, 5-aminoimidazole ribonucleotide; Cys, cysteine; Gly, glycine; His, histidine; HMP, 2-methyl-4-amino-5-hydroxymethylpyrimidine; THZ, 4-methyl-5- -hydroxyethylthiazole; Tyr, tyrosine; Vit. B6, Vitamin B6. Morett et al. Nature Biotech 21, 790 (2003) Softwarewerkzeuge
THI-PP biosynthesis pathway: analogous genes Negatively correlating gene occurrences are highlighted using the same colors. Species having at least two genes with a role unique to THI-PP biosynthesis are predicted to possess the functional pathway. The column 'STRING score' shows the most significant interaction for each gene, predicted using the STRING server. Predicted interaction partners are listed in the column 'Interact. with'. COG id: „id in groups of orthologous proteins server“ (a) Essential THI-PP biosynthesis enzymes, which are unique to the pathway. (b) Essential THI-PP biosynthesis enzymes, which have been implicated in more than one biological process. The thiO gene, suggested to play a role in the pathway, was also added to that list. (c) Proteins predicted in silico to be involved in the pathway. 4 analogies detected: thiE can be replaced by MTH861 thiL by THI80 thiG by THI4 thiC by tenA Morett et al. Nature Biotech 21, 790 (2003) Softwarewerkzeuge
Interpretation Proteins that functionally substitute eachother have anti-correlated distribution pattern across organisms. allows discovery of non-obvious components of pathways and function prediction of uncharacterized proteins and prediction of novel interactions. Morett et al. Nature Biotech 21, 790 (2003) Softwarewerkzeuge
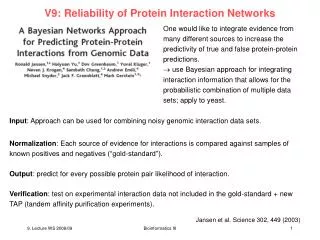
7 Construct complete network of gene association Network reconstructions have largely focused on physical protein interaction and so represent only a subset of biologically important relations. Aim: construct a more accurate and extensive gene network by considering functional, rather than physical, associations, realizing that each experiment, whether genetic, biochemical, or computational, adds evidence linking pairs of genes, with associated error rates and degree of coverage. In this framework, gene-gene linkages are probabilistic summaries representing functional coupling between genes. Only some of the links represent direct protein-protein interactions; the rest are associations not mediated by physical contact, such as regulatory, genetic, or metabolic coupling, that, nonetheless, represent functional constraints satisfied by the cell during the course of the experiments. Working with probabilistic functional linkages allows many diverse classes of experiments to be integrated into a single coherent network which enables the linkages themselves to be more reliably Lee, ..., Marcotte, Science 306, 1555 (2004) Softwarewerkzeuge
Method for integrating functional genomics data Benchmark functional genomics data sets for their relative accuracies. Several raw data sets already have intrinsic scoring schemes, indicated in parentheses (e.g., CC, correlation coefficients; P, probabilities, and MI, mutual information scores). These data are rescored with LLS, then integrated into an initial network (IntNet). Additional linkages from the genes’ network contexts (ContextNet) are then integrated to create the final network (FinalNet), with È34,000 linkages between 4681 genes (ConfidentNet) scoring higher than the gold standard (small-scale assays of protein interactions). Hierarchical clustering of ConfidentNet defined 627 modules of functionally linked genes spanning 3285 genes (‘‘ModularNet’’), approximating the set of cellular systems in yeast. Lee, ..., Marcotte, Science 306, 1555 (2004) Softwarewerkzeuge
Scoring scheme for linkages Unified scoring scheme for linkages is based on a Bayesian statistics approach. Each experiment is evaluated for its ability to reconstruct known gene pathways and systems by measuring the likelihood that pairs of genes are functionally linked conditioned on the evidence, calculated as a log likelihood score: P(L|E) and P(L|E) : frequencies of linkages (L) observed in the given experiment (E) between annotated genes operating in the same pathway and in different pathways P(L) and P(L): the prior expectations (i.e., the total frequency of linkages between all annotated yeast genes operating in the same pathway and operating in different pathways). Scores > 0 indicate that the experiment tends to link genes in the same pathway, with higher scores indicating more confident linkages. Lee, ..., Marcotte, Science 306, 1555 (2004) Softwarewerkzeuge
Benchmarks As scoring benchmarks, the method was tested against two primary annotation references: (1) the Kyoto-based KEGG pathway database and (2) the experimentally observed yeast protein subcellular locations determined by genome-wide green fluorescent protein (GFP)–tagging and microscopy. KEGG scores were used for integrating linkages, with the other benchmark withheld as an independent test of linkage accuracy. Cross-validated benchmarks and benchmarks based on the Gene Ontology (GO) and COG gene annotations provided comparable results. Lee, ..., Marcotte, Science 306, 1555 (2004) Softwarewerkzeuge
Functional inference from interaction networks Benchmarked accuracy and extent of functional genomics data sets and the integrated networks. A critical point is the comparable performance of the networks on distinct benchmarks, which assess the tendencies for linked genes to share (A) KEGG pathway annotations or (B) protein subcellular locations. x axis: percentage of protein-encoding yeast genes provided with linkages by the plotted data; y axis: relative accuracy, measured as the of the linked genes’ annotations on that benchmark. The gold standards of accuracy (red star) for calibrating the benchmarks are smallscale protein-protein interaction data from DIP. Colored markers indicate experimental linkages; gray markers, computational. The initial integrated network (lower black line), trained using only the KEGG benchmark, has measurably higher accuracy than any individual data set on the subcellular localization benchmark; adding context-inferred linkages in the final network (upper black line) further improves the size and accuracy of the network. Lee, ..., Marcotte, Science 306, 1555 (2004) Softwarewerkzeuge
Features of integrated networks At an intermediate degree of clustering that maximizes cluster size and functional coherence, 564 (of 627) modules are shown connected by the 950 strongest intermodule linkages. Module colors and shapes indicate associated functions, as defined by Munich Information Center for Protein Sequencing (MIPS), with sizes proportional to the number of genes, and connections inversely proportional to the fraction of genes linking the clusters. Lee, ..., Marcotte, Science 306, 1555 (2004) Softwarewerkzeuge
Features of integrated networks Portions of the final, confident gene network are shown for (C) DNA damage response and/or repair, where modularity gives rise to gene clusters, indicated by similar colors, and (D) chromatin remodeling, with several uncharacterized genes (red labels). Networks are visualized with Large Graph Layout (LGL). Lee, ..., Marcotte, Science 306, 1555 (2004) Softwarewerkzeuge
zusätzliche Folien (nicht benutzt) Softwarewerkzeuge
1. Methods for the structural characterization of macromolecular assemblies (a) Electron diffraction map and 3D X-ray protein structure. X-ray provides atomic-resolution structures. (b) 3D protein structure and plot showing chemical shifts determined by NMR. NMR spectroscopy extracts distances between atoms by measuring transitions between different nuclear spin states within a magnetic field. These distances are then used as restraints to build 3D structures. NMR spectroscopy also provides atomic-resolution structures, but is generally limited to proteins of about 300 residues. It plays an increasingly important role in studying interaction interfaces between structures determined independently. (c) EM micrograph and 3D reconstruction of a virus capsid. EM is based on the analysis of images of stained particles. Different views and conformations of the complexes are trapped and thus thousands of images have to be averaged to reconstruct the three-dimensional structure. Classical implementations were limited to a resolution of 20 Å. More recently, single-particle cryo techniques, whereby samples are fast frozen before study, have reached resolutions as high as approximately 6 Å. EM provides information about the overall shape and symmetry of macromolecules. (d) Slice images and rendered surface of a ribosome-decorated portion of endoplasmic reticulum. In electron tomography, the specimen studied is progressively tilted upon an axis perpendicular to the electron beam. A set of projection images is then recorded and used to build a 3D model. This technique can tackle large organelles or even complete cells without perturbing their physiological environment. It provides shape information at resolutions of approximately 30 Å. (e) Yeast two-hybrid array screen and small network of interacting proteins. Interaction discovery comprises many different methods whose objective is to determine spatial proximity between proteins. These include techniques such as the two-hybrid system, affinity purification, FRET, chemical cross-linking, footprinting and protein arrays. These methods provide very limited structural information and no molecular details. Their strength is that they often give a quasi-comprehensive list of protein interactions and the networks they form. Russell et al. Curr. Opin. Struct. Biol. 14, 313 (2004) Softwarewerkzeuge
Putative structure through modeling and low-resolution EM (a) Exosome subunits. The top of the panel shows the domain organization of two subunits present in the complex, but lacking any detectable similarity to known 3D structures. The model for the nine other subunits (bottom) was constructed by predicting binary interactions using InterPReTS and building models based on a homologous complex structure using comparative modeling. (b) EM density map (green mesh) with the best fit of the model shown as a gray surface and the predicted locations of the subunits labeled. The question marks indicate those subunits for which no structures could be modeled. Russell et al. Curr. Opin. Struct. Biol. 14, 313 (2004) Softwarewerkzeuge
5 Pairwise docking: Katchalski-Kazir algorithm; FTDOCK Discretize proteins A and B on a grid. Every node is assigned a value Use FFT to compute correlation efficiently. Output: solutions with best surface complementarity. Gabb et al. J. Mol. Biol. (1997) Softwarewerkzeuge
2. Yeast 2-Hybrid Screen Data on protein-protein interactions from Yeast 2-Hybrid Screen. One role of bioinformatics is to sort the data. Softwarewerkzeuge
Protein cluster in yeast Cluster-algorithm generates one large cluster for proteins interacting with each other based on binding data of yeast proteins. Schwikowski, Uetz, Fields, Nature Biotech. 18, 1257 (2001) Softwarewerkzeuge
Annotation of function After functional annotation: connect clusters of interacting proteins. Schwikowski, Uetz, Fields, Nature Biotech. 18, 1257 (2001) Softwarewerkzeuge
Annotation of localization Schwikowski, Uetz, Fields, Nature Biotech. 18, 1257 (2001) Softwarewerkzeuge
3. Systematic identication of large protein complexes Yeast 2-Hybrid-method can only identify binary complexes. Cellzome company: attach additional protein P to particular protein Pi , P binds to matrix of purification column. yieldsPi and proteins Pk bound to Pi . Identify proteins by mass spectro- metry (MALDI- TOF). Gavin et al. Nature 415, 141 (2002) Softwarewerkzeuge
Analyis of protein complexes in yeast (S. cerevisae) Identify proteins by scanning yeast protein database for protein composed of fragments of suitable mass. Here, the identified proteins are listed according to their localization (a). (b) lists the number of proteins per complex. Gavin et al. Nature 415, 141 (2002) Softwarewerkzeuge
Validation of methodology Check of the method: can the same complex be obtained for different choice of attachment point (tag protein attached to different coponents of complex)? Yes (see gel). Method allows to identify components of complex, not the binding interfaces. Better for identification of interfaces: Yeast 2-hybrid screen (binary interactions). 3D models of complexes are important to develop inhibitors. • theoretical methods (docking) • electron tomography Gavin et al. Nature 415, 141 (2002) Softwarewerkzeuge
Potential errors in biochemical interaction discovery (a) Indirect interactions between cyclin-dependent kinase regulatory subunit (CKS) and cyclin A detected by the Y2H system. Several interactions between CKS domains and cyclins were reported in genome-scale two-hybrid studies. However, analysis of 3D structures suggests that the endogenous cyclin-dependent kinase 2 (CDK2) probably mediates the interaction, as combining the CDK2–CKS and CDK2–cyclin A structures places the CKS and cyclin domains 18 Å apart. (b) An example of an interaction that is not detected by any screen, possibly because molecular labels (e.g. affinity purification tags, or two-hybrid DNA binding or activation domains) are interfering with the interaction. The X-ray structure of the actin–profilin complex reveals that the actin C terminus (C-t) lies at the interaction interface (the other N and C termini are also labeled). Russell et al. Curr. Opin. Struct. Biol. 14, 313 (2004) Softwarewerkzeuge