Download
1 / 22
220 likes | 374 Views
Trade-offs, Comparative Advantage, Market System. Chapter 2. Trade-offs , Comparative Advantage, and Market System. 1. The scarcity and OC concepts can be explained in terms of the production possibilities schedule (PPS), or curve (PPC), frontier (PPF) PPS or PPC ( PPF ) is:

E N D
Trade-offs, Comparative Advantage, and Market System 1. The scarcity and OC concepts can be explained in terms of the production possibilities schedule (PPS), or curve (PPC), frontier (PPF) PPS or PPC (PPF) is: a table (PPS )or graph (PPCor PPF) showing alternative combinations of two goods that could be produced with available resources and technology.
2. An Example of Production Possibilities Schedule (PPS)- a Case of Increasing OC
PPC Curve- Case of Increasing OC • Bread This implies that productive resources are not perfectly substitutable 20 TV Set 5
3. Constant vs Increasing OC • A constant OC is a case where the amount we give up to get something remains the same (2 Hotdogs for 1 Ham). PPC is a straight line. • It impliesperfect substitution of resources. • Increasing OC occurs when we have to give up more and more to get each additional unit (More and more Bread units for a TV Set). PPC is a Curve is concave- bows to the origin • It implies an imperfect resource substitution- realistic
4. Law of Increasing OC • This law suggests that the opportunity cost of each additional TV set continues to increase (more realistic). • It also implies that there is a trade-off between the production of TV and Bread i.e. getting more TV Sets comes at the expense of giving up more and more of bread units.
5. PPC Assumptions • a. Assumption of PPC are : • -Full employment of resources • -Fixed technology • -Finite resources at given point in time • b. A point (X )inside the PPC implies • underutilization of resources. • c. a point (Y) outside the frontier implies • unattainable combination • d. A point on the PPC implies full employment • and use of best technology or method of production.
PPC Applications 6. Some Applications of the PPC or PPF - illustrates scarcity, choice, OC. - shows economic growth as reflected by the shift in the PPC or PPF. 7. An economy is considered to be efficient when the forces of demand and supply determine the prices of goods and services The function of price is to allocate (channel) resources to their best use.
8. Why Do We Trade? • There are mutual gains from trade • Trade improves the welfare of trading partners
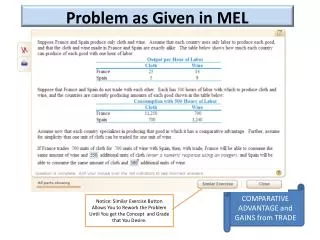
9. An Example trade between the farmer and the rancher • The rancher and the farmer are both able to produce beef and potatoes. • Ounces (Meat and Potatoes) Produced in 8 Hours Work Per Day • Pre –Trade Opportunity Costs • Meat Potatoes OC OC’ • Farmer 8oz 32oz 1M=4P 1P=1/4M • Rancher 24oz 48oz 1M=2P 1P=1/2M
10. Absolute Advantage • Question: Who is more productive in both goods in absolute terms? The Rancher • The rancher is said to have an Absolute Advantage (AA). • What is AA? – The comparison among producers according to productivity. • It implies that the rancher should produce both meat and potatoes. Hence AA does not establish the basis for trade. • Question: Who can produce meat at a relatively cheaper cost? Who can produce potatoes at a relatively cheaper cost? • It depends on who has a Comparative Advantage (CA) in what good based on OC.
11. Comparative Advantage • Question: Who has a CA in the production of Meat? Look at the table – the rancher, because the OC of 1M = only 2P to the rancher, whereas it is 4P to the farmer. • 11. CA – the comparison among producers according to opportunity cost. • Who has a CA in Potatoes? – the farmer, of necessity. Why? Because the OC of 1P is only ¼M to the farmer, whereas it is ½ M of meat to the rancher.
12. Comparative Advantage as Basis of trade • CA implies that each must specialize in what it does best and trade for what it does not have. Therefore, CA establishes the basis of trade. • 13. For this to happen, there must be a difference in the exchange ratios between the Farmer and Rancher, i.e. 1:4 and 1:2=> limits to terms of trade (domestic exchange ratios). • In order for trade to be beneficial to both, the terms of exchange must always be between the exchange ratio for each individual, say 1M = 3P. • Question: How does a 1M = 3P benefit both? Notice that the rancher only used to get 2P for 1M before trade. Since it does not produce potatoes after specialization in meat, the rancher is happy to get 3P for 1M.
Comparative Advantage as Basis of trade • The farmer is also happy to get 1/3 M for 1P after trade than the pre-trade of only ¼ M for 1P. Thus, trade based on CA benefits both trading partners. • CA advantage leads individuals or countries to specialize in what they do best. • Cubans in cigars, Germans in cameras, Japanese in HDTV’s, etc. • Comment: How does trade benefit trading partners? • Trade is based on CA → Specialization → Division of Labor →Efficiency → Increased production → Increased consumption →Trade is beneficial to both. • Question: Should Novak Djokovic mow his lawn? No. Explain why? The OC of mowing his lawn is too high than to hire someone.
14. Specialization and Trade • Individuals and countries will be better off by specializing in what they do best and trading with their neighbors. • The result is that scarce resources are used most efficiently and the collective material well-being is improved.
15. The Circular-Flow Diagram • A model (diagram) that shows how markets participants (buyers and sellers) are linked (Hubbard-O’Brien) • A visual model of the economy that shows how dollars flow through markets among households and firms (Mankiw)
15. The Circular-Flow Diagram Businesses Households
15. The Circular-Flow Diagram Products and Services Businesses Households Inputs or Factors of Production
The Circular-Flow Diagram. Payments for Products and Services $ $ The Flow of Dollars Businesses Households $ $ Wages, Rent, Interest and Profits
The Circular-Flow Diagram. Product Market $ $ Businesses Households $ $ Market for Factors of Production
Circular-flow diagram • A model that shows how participants in markets are linked (HO) • A visual model of the economy that shows how dollars flow through markets among households and firms (Mankiw
Efficiency • "An efficient economy utilizes all of its available resources and produces the maximum amount of output that its technology permits."