IT Project Management
IT Project Management. SEEM 5730 IT Management Prof. K.F. WONG. Agenda. Introduction to Project Management Lessons Learnt on Managing IT Projects. Introduction to Project Management. Prof. K.F. WONG. What is the current business environment?. Market situation Perfect information


IT Project Management
E N D
Presentation Transcript
IT Project Management SEEM 5730 IT Management Prof. K.F. WONG
Agenda • Introduction to Project Management • Lessons Learnt on Managing IT Projects
Introduction to Project Management Prof. K.F. WONG
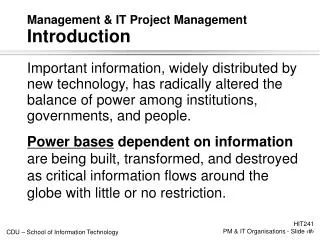
What is the current business environment? • Market situation • Perfect information • Hyper-competitive in nature • Focus on time-to-market • Breakdown of barriers of product/ service offerings • Companies’ challenges • Resource/ cost management • Make wise decision to focus the resources (i.e. betting the trend) • Maintain knowledge within the performing organization • Quick response to the market and its competitors
Ways to sustain the business • Choosing the right projects – a new kind of strategic planning • Keeping the best people within the organization • Permanently linking strategies to projects • Managing the project portfolio correctly • Continuously improve knowledge within the organization • Develop ways to measure success and failure of projects • Unbiased resource allocation and utilization
Project Failure Statistics • Roughly 40 % of all IT projects fail to meet business requirements. (TechRepublic Inc./ Gartner Group) • 74 % of all projects fail, come in over budget or run past the original deadline... 28% of projects fail altogether. Every year, $75 billion is spent on failed projects in the U.S.(The Standish Group, 1998) • 31.1 % of projects will be canceled before they ever get completed. (The Standish Group, June 1999) • The percentage of IT projects that fail to meet objectives hovers near 50 percent. (Gartner Group, “Project Management: A New Look for a New Economy”, December 2000)
Pressure faced by senior management Can we take on this project? How long will it take? What will it cost? Is there an opportunity to finish early? Does the business unit know this? What is the #1 project in the department? Is our project portfolio aligned with the business needs? What if Richard moves to another project? Are we meeting our commitments? If only we had more budget & resources to do the work? What will be the impact if we miss our next milestone? What program do we do first? Are we at risk of not achieving our fiscal year strategic initiatives? The Project/ Program Management Challenge
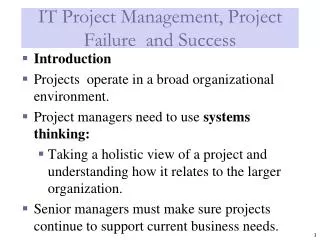
A Project is :- • A project is a temporary endeavour undertaken to create a unique product, service, or result. • Finite. i.e. there is a definite end. • Complex. involves a mixture of series and parallel activities with a significant interplay of human skills as well as resources of materials and facilities. • Non-repetitive. a unique one time effort only.
Project Management Every detail from inception to completion needs to be managed. There are three main phases :- • Management decision determines what the project is to be, its scope and limits. • Project planning done in advance and during the project determines how the project is to be run. • Project control performed while the project is running organises and guides activities towards the conclusion.
Project Management Processes • Processes (IPECC) Initiating Planning Executing Controlling Closing • Knowledge areas: • Project integration • Scope management • Time management • Cost management • Quality management • Human resources management • Communications management • Risk management
The Triple Constraint of Project Management Source: Kathy Schwalbe Information Technology Project Management Thomson, 2004
Project Managers • Ensure the system is consistent with its requirements. need to be able to : • control the projects development. • be aware of the problems that can occur need to be responsiblefor: • documentation • standards • the people
Scope Statement • Project Title: • Date: • Prepared by: • Project Justification: • Product Characteristics/Requirements: • Summary of Project Deliverables: • Project management-related deliverables: • business case, • Charter • team contract, • Work Breakdown Structure WBS • schedule, • cost baseline, • Product-related deliverables: • Project Success Criteria
Functional Specification Introduction • Purpose of the document • Scope • Overview • Business Context • General Description • Product Functions • System Information • User Characteristics • Problem statement • Objectives • Constraints • Functional Requirements • Description • Criticality • Cost and schedule • Risks • Dependencies Interface Requirement • User Interfaces • Hardware Interfaces • Network Interfaces • Software Interfaces • Performance Requirements • Speed • Memory • non-functional attributes • Security • Compatibility • Portability • Reusability • Extensibility • Serviceability • Maintainability
When it comes to decision… Force Field Analysis
Force field analysis • A method used to get a whole view of all the forces for or against a plan so that a decision can be made which takes into account all interests. • a specialized method of weighing pros and cons. • allows you to look at all the forces for or against the plan. • helps you plan or • reduce the impact of the opposing forces, and • strengthen and reinforce the supporting forces.
1.INTRODUCTION 1.1Purpose 1.2Objective 1.3Scope 1.4References 1.5Definitions, acronyms and abbreviations 2.PROJECT ORGANIZATION 2.1Project team 2.2Project Responsibilities 2.3Organization boundaries and interfaces 3.WORK BREAKDOWN, RESOURCE AND SCHEDULE 3.1Work breakdown Structure and Workload estimates 3.2Other Facilities and Resources 3.3Milestones and deliverables 3.4Task Dependencies 3.5Schedule 3.6Methods, tools and techniques 3.7Project support functions 4.PROJECT MANAGEMENT 4.1Assumptions, dependencies and constraints 4.2Risk management 4.3Quality assurance 4.4Progress reporting Project Plan
Gantt Charts • Gantt charts provide a standard format for displaying project schedule information by listing project activities and their corresponding start and finish dates in a calendar format • Symbols include: • A black diamond: milestones or significant events on a project with zero duration • Thick black bars: summary tasks • Lighter horizontal bars: tasks • Arrows: dependencies between tasks
Techniques for Shortening a Project Schedule • Shortening durations of critical tasks for adding more resources or changing their scope • Crashing tasks by obtaining the greatest amount of schedule compression for the least incremental cost • Fast tracking tasks by doing them in parallel or overlapping them
Shortening Project Schedules Original schedule Shortenedduration thru crashing Overlapped Tasks or fast tracking
Program Evaluation and Review Technique (PERT) • PERT is a network analysis technique used to estimate project duration when there is a high degree of uncertainty about the individual activity duration estimates • PERT uses probabilistic time estimates based on using optimistic, most likely, and pessimistic estimates of activity durations • PERT weighted average formula: Optimistic Estimate + (4 times Most Likely Estimate) + Pessimistic Estimate divided by 6
Example • If you were installing a new web portal infrastructure, you might have a task to make sure that portal is secure from hackers. Your problem is estimating the duration to complete the task called "conduct security testing and resolve any findings on a ten-server Solaris cluster". • You or your system architect determine: • At best, you need 24 man-hours • Most likely you need 36 man-hours • And if everything goes wrong, you need 51 man-hours • Your PERT estimating equation for that task would be: • (24 + 4(36) + 51)/6 = 36.5 • Your weighted average is 36.5 hours to complete that task activity. Of course, you still need to figure out what sort of skills you need to perform each of those man-hours on this task activity, but that's a resource management issue rather than an estimating concern. Source: http://www.bluejeansplace.com/PERT-EstimatingFormula.html
Controlling Changes to the Project Schedule • Perform reality checks on schedules • Allow for contingencies • Don’t plan for everyone to work at 100% capacity all the time • Hold progress meetings with stakeholders and be clear and honest in communicating schedule issues
Project Management Failure Warning Signals • WARNING SIGN: No PERT estimate completed prior to giving the price quotation to the customer • WARNING SIGN: Heavy discounting by sales or executives to get the project with no outside (read no PM) validation • WARNING SIGN: Sales representative gives you a blank look, argues, walks away or outright refuses when you ask for his calculations which support his price • WARNING SIGN: "Just do it" or "Just get it done" is heard on a frequent occasion • WARNING SIGN: Someone's cell phone bill goes higher each month as the project progresses • WARNING SIGN: Overemphasis on producing or updating Gantt charts and other illustrations; but little emphasis on other PMBOK tools like risk assessments • WARNING SIGN: Version after version after version of briefings are created to communicate project information rather than just presenting a straight-forward business problem and solution.
Lessons Learnt on Managing IT Projects Prof. K.F. WONG
Two cases on regional ERP (Enterprise Resources Planning) implementation The Two Cases • Knowledge areas: • Integration Management - Scope management • Time management - Cost management • Quality management - Human resources management • Communications management - Risk management
Company A mainland China provincial SOE power company that has branches in 18 cities Objective The company “thinks” that it need a new ERP solution Scope Redesign and Automation - HR, Finance and Supply Chain Duration Complete the implementation within 2 years Case 1 – Project Details
Case 1 – Project Details Project Team and Implementation Partners • The project team – mainly from internal IT department - has no ERP experience and no in-depth project management knowledge • Two contractors were engaged – Prime and Sub • Prime contractor – Local vendor with solid experience in process design for power companies but has no ERP implementation experience. This vendor had other engagement with the company before • Sub contractor – An international well-known ERP implementer • A PM from the prime contractor was appointed as the program manager for the project & PM from the subcontractor acted as deputy program manager • Subcontractor was responsible for analysis and design • Prime contractor was to assist in the customization and configuration work
Case 1 – How did the project go? BPR phase (4 months) • Prime and sub contractors shared difference views on how the future processes should be. Finally, the prime contractor proposed processes were used Analysis and Design phase (4 months) • Subcontractor identified many customizations has to be made during the analysis phase • Prime contractor convinced the Steering Committee that they are capable of taking up all the customizations development and the rest of the implementation • After the detailed design was done, the subcontractor was being kicked out and prime contractor took up the whole implementation
Case 1 – How did the project go? Pilot implementation (5 months) • Lost control of the implementation – Took 12 months instead of 5 months • Negative feedback from users after pilot go-live Full Rollout (9 months) • Prime contractor was finally kicked out & another implementer was engaged • It took the new implementer another 6 months to revamp the system. • The provincial rollout which took another 12 months (instead of 9 months) was another failure. • The total project is USD 6 millions more than the original USD 10 millions budget • After the system full rollout for 2 years, the company has started to look for another ERP system to replace this one
Company A global financial institution that has presence in 10 countries across the Asia/Pacific region Objective The company’s regional office has committed that one of the top IT priorities for the next 18 – 24 months was to consolidate the HR systems across the Asia Pacific region Scope Develop a common set of processes that can be used across region and a new ERP system needed to be implemented to support this new set of processes Duration Complete the implementation within 18 – 24 months Case 2 – Project Details
Case 2 – Project Details Management Support • The project team got the buy-in from regional and business units’ senior management and HR team on the implementation. Project Team and Implementation Partners • A well known ERP vendor was engaged during the “Planning and common process design” stage • The project team who have extensive experienced in the ERP implementation were responsible for the implementation • Project manager has experience in both successful and “unsuccessful” ERP implementation Project Management Methodology • The company has its own Project Management Methodology (adapted from PRINCE2 and PMP) • The in-house project team members are familiar with all phases, tasks, templates and tools of the PM methodology
Case 2 – How did the project go? Planning (3 months) • The project team spent considerable amount of time in planning and developing the common process design. • User representatives from all business units were heavily involved through the whole process • The company’s PM methodology was communicated to users in great details • Risk Assessment was done during the planning phase Analysis and Design (3 months) • All business units fully understand that it’s a regional system that they have to contribute as much as possible and also adopt the final processes • It was agreed that customization should be kept to a minimal
Case 2 – How did the project go? Pilot Implementation (4 months) • India was selected as the pilot site for the implementation and local implementation partners was engaged to reduce the overall cost • The pilot implementation was completed in 3 months (instead of 4 months) Review and fine-tuning process (2 months) • Walkthrough sessions were organized for user representatives. They were very involved in the review process and provided very positive feedback. Full Regional Rollout (6 months) • Regional rollout to all other 10 countries within the following 5 months • The project cost is USD 0.5 millions less than what was original budgeted (USD 3 millions)
Summary • Critical Success Factors for ERP Implementation • Strong management support • Manage your stakeholders’ expectation • Communicate and apply a project management methodology • Build a competent in-house team • Engage vendor who really have expertise and experience
Acknowledgement • The content of this set of PowerPoint slides is provided by International Association of Project & Program Management (IAPP) • Thanks are due to Sally Ng and Kim Leong