TO READERS
Antibiogram 2002-2009 in Washoe County Nevada – Know the Local Data, Prevent Antimicrobial Resistance Lei Chen, Ph.D., Senior Epidemiologist, Washoe County Health District, Reno, Nevada. Email: lchen@washoecounty.us. BACKGROUND. RESULT.

TO READERS
E N D
Presentation Transcript
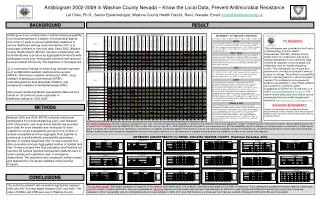
Antibiogram 2002-2009 in Washoe County Nevada – Know the Local Data, Prevent Antimicrobial Resistance Lei Chen, Ph.D., Senior Epidemiologist, Washoe County Health District, Reno, Nevada. Email: lchen@washoecounty.us BACKGROUND RESULT • Antibiogram is an overall profile of antimicrobial susceptibility of a microbial species to a battery of antimicrobial agents. One of the 12 steps to prevent antimiobial resistance in various healthcare settings recommended by CDC is to encourage clinicians to use local data. Since 2002, Washoe County Health District (WCHD) has been collaborating with local laboratories to produce an aggregated community-wide antibiogram every year. Antibiogram has been well received by local medical community. The objectives of this paper are: • to summarize findings on major drug resistant organism such as Methicillin-resistant staphylococcus aureus • (MRSA), Vancomycin-resistant enterococci (VRE), drug-resistant streptococcus pneumoniae (DRSP), • extended-spectrum beta-lactamase (ESBLs), and carbapenem resistant enterobacteriaceae (CRE); • to present detailed antibiotic susceptibility data and their trends on 18 commonly seen organisms in • healthcare setting for 2002-2009. TO READERS This antibiogram was compiled by the Division of Epidemiology & Public Health Preparedness (DEPHP), Washoe County Health District in collaboration with all four hospital laboratories in the community. Data covered all inpatients in local hospitals and outpatients seen at hospital emergency rooms. This antibiogram can be used as a reference for clinicians but shouldn't serve as a basis for therapy. The antibiotic susceptibility test for individual patients is still encouraged, if needed. This antibiogram only represents antibiotic susceptibility in vitro. Please address your questions, comments, and/or suggestions to DEPHP at 775-328-2447 or e-mail to EpiCenter@WashoeCounty.us. The online version and pocket size version can be downloaded from the Health Department’s website at www.washoecounty.us/health/cdpp/warr.html ACKNOWLEDGEMENTS Northern Nevada Medical Center Laboratory, Renown Regional Medical Center Laboratory, Saint Mary’s Regional Medical Center Laboratory, Veteran’s Affairs Medical Center Laboratory (Reno). METHODS Between 2002 and 2006, WCHD collected institutional antibiograms from local laboratories every year. Between 2007 and present, only local clinical laboratories provided such data. An excel template was developed for each organism to covert susceptibility percent to the number of isolates susceptible and then aggregate them together to produce an overall antibiotic susceptibility percentage. Number of isolates tested less than 10 was excluded from data conversion process. Aggregated number of isolates less than 30 was excluded from final calculation and therefore not reported. All isolates reported represented inpatients seen in local hospitals and outpatients seen in emergency departments. The resistance rate comparison between years was assessed by Chi-square statistics using OpenEpi Program. To read this antibiogram: 1) Each organism is presented in two rows. The top row represents susceptibility in percent to that antibiotic. The 2nd row represents number of isolates tested for that specific antibiotic. 2) Susceptibility greater than or equal to 90% is highlighted in light GREEN, 60%-89% in YELLOW, and less than 60% in RED. 3) Nitrofurantoin is tested for urine specimens only. 4) The susceptibility result for Streptococcus pneumoniae is a combination of screening test and E-test results. 5) CLSI performance standards for antimicrobial susceptibility testing were applied. CLSI stands for Clinical and Laboratory Standards Institute (Formerly NCCLS, The National Committee for Clinical Laboratory Standards). 6) Black empty shaded cells indicate that susceptibility testing for that specific organism is not recommended or complete testing data was not available or number is too small for valid reporting. ANTIBIOTIC SUSCEPTIBILITY (%) TREND, 2002-2009, WASHOE COUNTY (Published December, 2010) CONCLUSIONS The antibiotic resistant rate increased significantly between 2002 and 2007 but was stable between 2007 and 2009. The rates of ESBLs and CRE were low in Washoe County. To read these graphs: Each graph represents an organism; X-axis represents the abbreviation of an antibiotic (see tables above graphs for full name of antibiotics); Y-axis represents susceptibility in percent; legends indicate each year and number of isolates identified for that year in parentheses. Attention! Readers should be aware that resistance rate calculation for 2004 from some hospitals was different compared to prior years due to removing duplicates in 2004. Susceptibility result for Acinetobacter Baumanii was available in 2006, 2007, and 2009 therefore only three year trend data was available. Antibiogram 2005 and 2008 were not available.