Download
1 / 48
550 likes | 912 Views
Throughput and Overcrowding in the ED – So What Else is New?. Christy Dempsey, RN MBA CNOR August 26, 2009. Objectives for Today’s Session. Understand how other areas of the hospital directly impact the flow of patients in the ED

E N D
Throughput and Overcrowding in the ED – So What Else is New? Christy Dempsey, RN MBA CNOR August 26, 2009
Objectives for Today’s Session • Understand how other areas of the hospital directly impact the flow of patients in the ED • Demonstrate how queuing analysis and simulation modeling can be employed inside and outside the ED to improve flow and increase capacity without building infrastructure or hiring more staff • Learn how other organizations have used this information and methodology for significant and sustainable results
Institute of Medicine Report – June 2006 • "Hospital chief executive officers should adopt enterprise-wide operations management and related strategies to improve the quality and efficiency of emergency care.” • “By smoothing the inherent peaks and valleys in patient flow, and eliminating the artificial variabilities that unnecessarily impair patient flow, hospitals can improve patient safety and quality while simultaneously reducing hospital waste and cost.”
Today’s Hospital Environment • ED and PACU boarding/overcrowding • Staff shortages - nursing and physician • The “any bed available” phenomenon • Quality concerns related to nurse:patient ratios, medical errors, and adverse events • Frustration due to unpredictable schedules and inability to care for patients the way physicians want to care for them • Increasing workloads and decreasing reimbursement
Patient Flow Which do we have the most control over??
Direct Admits? • NO • These are usually sick patients • Sent from physician office • May be scheduled through Cath Lab or other procedural area – higher risk patients • Random arrivals
ED? • NO
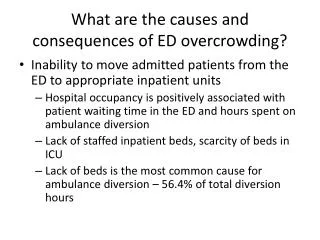
Robert Wood JohnsonFoundation • “ED overcrowding is caused by a complex set of conditions that occur across hospital units and across the entire health care system. Inability to move admitted patients from the ED to the appropriate inpatient unit stands out as a major driver of ED overcrowding.” Emergency Department Utilization and Capacity July 2009
OR? • YES!! • Variability in the elective surgery schedule is the culprit • Totally schedulable • Totally within our control • Peaks and valleys in the elective schedule result in peaks and valleys in inpatient census
Consequences • Boarding • ED • PACU • OR • Inappropriate patient placement • Any bed available • Increased length of stay • Increased risk of morbidity/mortality • Increased risk of adverse events
Physician Consequences • Physicians • Frustration due to unpredictable schedules • Rounding in multiple locations • Long waits to do cases – elective and non-elective • Frequent phone calls from nurses unaccustomed to care for their patients • Longer lengths of stay result in increased risk of complications, infection, adverse events • Inability to grow, practice and revenue implications
Staff Consequences • Unpredictable schedules • OT • Low workload days • Staffing unfamiliar cases • Equipment competition • Recruitment and retention issues • Training issue for downstream nursing units
ED Consequences • Overcrowding • Boarding • Diversions • Safety • Quality • Liability • Burnout • Recruitment/Retention
Hospital Consequences • Lower overall utilization despite overcrowding • Loss of contracted payors • Liability • Reduced reimbursement – medical errors, never events, boarding • Capital constraints • Duplication of human and material resources during peaks • Wasted human and material resources during valleys
What to do? • Recognize flow is an organizational issue • ED is at the mercy of the inpatient census • Manage uncontrollable variability • ED admissions • Reduce/eliminate controllable variability • Smooth elective hospital admissions • Assure transparent and credible data • Involve physicians • Make progress
Address the Cause The Cause? Controllable (Artificial) Variability
Variability Types of Variability • Uncontrollable (Natural) • Random but often predictable • Manageable but cannot be eliminated • Example: emergent/urgent ED volume • Controllable (Artificial) • Non-random • Caused by management practices such as scheduling, staffing practices • Example: elective surgery schedule
Where to Start • Combine the hard science of rigorous data collection and analysis with the soft science of change management and operations expertise • Collaboration between physicians and hospital leadership • Culture must change—if you always do what you’ve always done, you’ll always get what you’ve always gotten!
Day to Day Variability Real-Life Variability in the OR
Patient Placement Inappropriate Patient Placement
Typical Fixes Three Typical “Fixes” • Build and staff to peak demand in EDs, ORs and in downstream units; tolerate overspending on staff and material expenses, underutilization during non-peak times • Staff below the peaks; tolerate ED diversions, nursing overloading and medical errors • Staff for averages and try to flex up or down to manage unpredictable demand; tolerate the same negative effects
3-step process A Better Way The Real Solution • Smooth artificial variability and provide resources to meet patient-driven(vs. schedule-driven) peaks in demand
Step 1 Step 1 Separate Scheduled from Unscheduled OR Flow • Step 1 implementation • Collect and analyze data on emergent/urgent (add-on) cases, including arrival patterns and urgency • Apply queuing theory to determine capacity needed to accommodate add-on cases within clinically acceptable wait times • Adjust plan based on physician and hospital input • Allocate resources to meet the separate demands of scheduled and unscheduled volumes
Step 2 Step 1 Separate Scheduled from Unscheduled OR Flow Step 2 Smooth flow of scheduled patients • Step 2 implementation • Evaluate daily case variation in scheduled cases by surgical service as well as by destination units • Work in collaboration with surgical practices to redesign the OR schedule to smooth daily case volume based on destination unit • Smoothing should take into account clinic schedules, surgeons’ teaching and other responsibilities, hospital case mix, and size of destination units
Step 3 Step 1 Separate Scheduled from Unscheduled OR Flow Step 2 Smooth flow of scheduled patients Step 3 Determine Bed and Staffing needs • Step 3 implementation • Apply simulation models to determine the number of beds and staff needed to achieve a desired level of service • Maximize throughput by streamlining the discharge process and addressing length of stay issues • Implement process improvement in downstream units including admission and discharge processes, ED specific flow improvements, hospitalist and medicine specific flow improvements
What is Queuing Theory? Mathematical tool used to determine capacity needed to handle random arrivals with constrained resources Used in industry since the early 1900’s Relevance to improving patient flow newly recognized Can be applied to any procedural area with a mix of elective and add-on cases
Queuing Theory Used When: Arrivals are random – ED volume and urgent/emergent OR cases Average service time - ED visit lengths or urgent/emergent surgical case duration + room turnover time - can be calculated Number of servers (ED treatment rooms/ physicians, OR, cath labs) is limited
Provides Guidance on: Optimum number of treatment or operating rooms for add-on (urgent/emergent) cases Optimum number of ED physicians Average wait time by triage or urgency class Percent of time an ED, ED physician, or OR will be available immediately for an emergency patient Utilization rates of ORs and ED rooms or physicians
ED Data Needed for Queuing Analysis Patient arrivals Triage level of patient arrivals Average visit length – door to door
Capacity Needs Based on Queuing • Inputs • Arrival rates by hour • Acuity of arrivals • Average service rate • Room turnover between patients • Staffed shifts • Desired waiting times • Outputs • Waiting time for each acuity • Utilization rates of rooms • Outputs by shift
What Happens When the Inputs Change? • Arrival patterns change • New hospital or closure of an ED increases volumes • Flu season • Treatment times change • Additional physician or nursing staff • Reduction of boarding allows for a reduction in average treatment time
Interpreting the Results Trade-offs between waiting time and resources applied Hard science vs soft science balance
Ensuring Compliance Active involvement by project committee of physician leaders, top hospital management Timely review of questionable urgency/acuity classifications Performance monitoring
Metrics for Monitoring Performance • Average wait time by triage/urgency class • Compliance with maximum wait time by triage/urgency class • Treatment room/physician utilization • Availability of a room when a level one (emergency) case arrives • Boarding days/times • Appropriate patient placement in downstream units
When to Adjust • Frequency of Re-evaluation • Quarterly under normal circumstances • Immediately if major issues • Triggers for Change • Non-elective volume increases or decreases • New services or surgeons with non-elective cases • Expansion or contraction of ED or OR capacity • Trade-offs related to Changes • Staff availability • Resource constraints
Patient Satisfaction with Waiting TimeHeartland Regional Medical Center
Physician Satisfaction Demonstrated Results: Physician Satisfaction Physician Satisfaction Increase Ease of Admitting Patients The most noticeable shifts (scores which changed >= +/- 3.0 points) tended to involve patient flow issues.
Reduced Variability Reduction of Variability Highest volume day (69 cases) is 1.6 times the lowest volume day (42 cases) vs. Substantial variability in elective surgery cases before: highest volume day (82 cases) is 2.15 times the lowest volume day (38 cases) BEFORE AFTER Wellstar-Kennestone
Useful References • http://www.rwjf.org/pr/product.jsp?id=45929&c • http://www.acep.org/uploadedFiles/ACEP/Membership/Sections_of_Membership/intnatl/news/2008BoardingReport.pdf • http://www.referenceforbusiness.com/encyclopedia/Pro-Res/Queuing-Theory.html • http://www.hhnmag.com/hhnmag_app/jsp/articledisplay.jsp?dcrpath=HHNMAG/Article/data07JUL2008/080715HHN_Online_Eitel&domain=HHNMAG • Litvak E, Long MC, Cooper A, McManus M. Emergency department diversion: Causes and solutions. Academic Emergency Medicine. 2001;8(11):1108-1110.
Contact Information Christy Dempsey, RN MBA CNOR SVP of Clinical Operations Press Ganey Associates, Inc 417-877-7666 cdempsey@pressganey.com