
Introduction
Fermentation Rate Varying Glucose Concentration Methodology

Introduction
E N D
Presentation Transcript
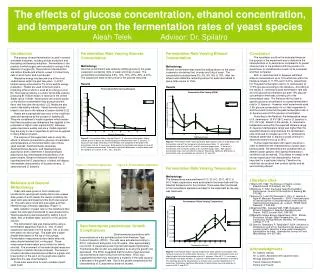
Fermentation Rate Varying Glucose Concentration Methodology Glucose concentration was varied by adding glucose to the yeast suspension containing 10mL of water and 0.4g of yeast. The concentrations studied were 2.5%, 10%, 15%, 20%, 25%, & 30%. The suspension were stirred until all of the glucose dissolved. Results Figure 3: Fermentation Rates Varying Glucose. S. cerevisiae withstands a higher osmotic pressure due to the increasing glucose concentration than S. bayanus. S. bayanus had a large initial drop in fermentation rate compared to the drop in the fermentation rate for S. cerevisiae. Both species fermentation rates began to level off at 15% glucose concentration. Statistically significant differences in fermentation rates are noted by an asterisk at 15%, 20%, and 30%. Fermentation Rate Varying Ethanol Concentration Methodology Ethanol concentration was varied by adding ethanol to the yeast suspension containing 5mL of water and 0.4g of yeast. The concentrations studied were 0%, 3%, 6%, 9%, & 12%. After the ethanol was added the remaining amount of water was added to give a total volume of 10mL. Results Figure 4: Fermentation Rates Varying Ethanol. Both species show an initial drop in the fermentation rate with the increase in ethanol concentration. S. cerevisiae’s fermentation rate levels off at 3% and 6% and then drops again. S. bayanus’s fermentation rate increases slightly at 6% and then drops again. Both species fermentation rates levels off after 9% ethanol. Statistically significant differences in fermentation rates are noted by an asterisk at 0% and 15%. Fermentation Rate Varying Temperature Methodology The temperatures measured were 10C, 21.6C, 30C, 40C, & 50C.Yeast suspensions were acclimated in the water bath with the selected temperature for five minutes. There were then transferred to the fermentation apparatus and kept in the water bath as the rate was measured. Results Figure 5: Fermentation Rates Varying Temperature. Both species fermentation rates increase linearly as the temperature increases. S, cerevisiae’s fermentation rates are slightly higher than the fermentation rates of S. bayanus. After 40C, S. cerevisiae’s fermentation rate drops whereas S. bayanus’s fermentation rate continues to increase. This could be due to the denaturing of an enzyme after a certain temperature in S. cerevisiae. Statistically significant differences in fermentation rates are noted by an asterisk at 30C and 40C. The effects of glucose concentration, ethanol concentration, and temperature on the fermentation rates of yeast speciesAleah Telek Advisor: Dr. Spilatro Introduction The process of yeast fermentation is used in several worldwide industries, including biofuel production and the baking and brewing industries. Fermentation is the process in which sugars are converted to energy in the absence of oxygen [5]. The products of fermentation are carbon dioxide and ethanol, except in human body cells in which lactic acid is produced. Alternative energy has become one of the most studied areas within the past few years. In 2007, biofuel energy accounted for 7% of the world’s energy production. Yeasts are used to ferment grains, producing ethanol which is used as an energy source [5]. The brewing industry is a major world wide industry, producing $17 billion dollars in revenue in the United States alone in 2008. Yeast strains are chosen based on the alcohol concentration they produce and the flavor that they give the alcohol [1,2]. Yeasts are also used in the baking industry. Yeasts are what cause bread to rise due to the release of carbon dioxide [1,2]. Yeasts are a saprophyte that occur in the unicellular state and reproduce by the process of budding [5]. They are considered a ‘model organism’ which means that their processes are studied and then applied to the processes of higher order organisms [5]. Because yeasts reproduce quickly and are a ‘model organism’ they are easy to use in experiments and can be applied to many different studies. The purpose of this experiment was to study the effects of ethanol concentration, glucose concentration, and temperature on the fermentation rate of three yeast species: Saccharomyces cerevisiae, Saccharomyces bayanus, and Saccharomyces pastorianus and to determine if Saccharomyces pastorianus has intermediate characteristics of its parent strains. Based on literature research it was hypothesized that S. pastorianus, a hybrid, will display intermediate characteristics of its parent strains, S. cerevisiae and S. bayanus. Conclusion The hypothesis could not be evaluated because the purpose of the experiment was to determine the characteristics of S. pastorianus compared to its parent strain but due to the problems with the growth of S. pastorianus its characteristics could not be evaluated and then compared. Both S. cerevisiae and S. bayanus withstand ethanol concentrations up to 15% which lies within the literature ranges of 11-15% and 13-21%, respectively [4]. The peak fermentation rate for S. cerevisiae is at 17.5% glucose according to the literature . According to the results S. cerevisiae’s peak fermentation rate was at 2.5% glucose concentration but after 15% glucose concentration there was a leveling off of the fermentation rates. The literature did not state a specific glucose concentration for a peak fermentation rate for S. bayanus. However, most experiments used 2.5% glucose concentration to run their experiments and the results show that the peak fermentation rate of S. bayanus was at 2.5% glucose concentration. According to the literature, the temperature range of S. cerevisiae is 10.5C-38C and for S. bayanus is 2C -35C [6]. Based on the results, S. cerevisiae’s temperature was within the expected literature range. S. bayanus’s temperature range was higher than the expected literature range because the fermentation rate continued to increase up to 50 C, whereas the literature stated that S. bayanus would continue to efficiently ferment only up to 35C. Further experimentation will need to be done in order to determine the characteristics of yeast strain being studied. By determining the characteristics of different yeast species, their optimal fermentation conditions can be defined. This allows for yeasts to be chosen based upon the characteristics that are important for a particular industry. Therefore the industries can produce their product quickly and be economically efficient. Figure 1: Filtration Apparatus Figure 2: Fermentation Apparatus Literature cited [1]Berry DR. 1982. The Biology of Yeasts. London: Edward Arnold (Publishers) Ltd. 57p. [2]D’Amore T. 1992. Improving Yeast Fermentation Performance. Journal of the Institute of Brewing 98: 375-382. [3]Jeune CL, Lollier M, Demuyter C, Erny C, Legras JL, Aigle M, Masneuf-Pomarede I. 2006. Characterization of natural hybrids of Saccharomyces cerevisiae and Saccharomyces bayanus var. uvarum. FEMS Yeast Research 7: 540-549. [4]Kalmokoff ML, Ingledew WM. 1985. Evaluation of Ethanol Tolerance in Selected Saccharomyces Strains. ASBC Journal 43(4): 189-196. [5]Marietta College Biology Department. 2005. Biofuel Production through Yeast Fermentation. In: Introductory Biology Manuel, Marietta, OH; Marietta College, P 1-15. [6] Serra A, Strehaiano P, Taillandier P. 2004. Influence of temperature and pH on Saccharomyces bayanus var. uvarum growth; impact of a wine yeast interspecific hybridization on there. International Journal of Food Microbiology 104: 257-265. Materials and General Methodology Yeast cells were grown in broth media and transferred to yeast growth media slants once a week. After growth in broth media, the media containing the yeast cells was centrifuged and the broth was poured off. The cells were rinsed with pure water and then filtered through a filtration apparatus (Figure 1). After collection of yeast cells on the membrane filter paper, the cells were transferred to yeast suspensions. Yeast suspensions were prepared by adding 0.4g of yeast, 5mL of distilled water, and 5mL of 5% glucose solution. The fermentation rate was measured by using a fermentation apparatus (Figure 2). 3mL of yeast suspension was taken into the syringe. 1mL of air was then taken into the syringe. The pipet with a water droplet was placed on the top on the syringe. Fermentation measurements were taken when the water droplet reached 0mL on the pipet. These measurements were taken every minute for twenty minutes. The movement of the water droplet measures the amount of carbon dioxide produced. The amount of carbon dioxide produced was plotted on a graph and linear portion of the point on the graph was used to determine the rate of fermentation. Three trials were done for each variable of each yeast strain. Saccharomyces pastorianus: Growth Complications Saccharomyces pastorianus cells were received as a dry activated culture from American Type Culture Collection (ATCC). The cells were activated according to ATCC instructions and grown in broth media. After approximately one month, S. pastorianus rate of growth decreased significantly. The literature did not offer any explanation as to why the growth rate decreased. The ATCC suggested that the culture may have been old and therefore could not survive the transfers. ATCC also suggested that there may have been a mutation in the cells causing a decrease in the growth rate. Due to the growth complications the characteristics of S. pastorianus were not studied. • Acknowledgments • Dr. Spilatro, Advisor • Dr. Lustofin, Assistance with capstone class • Biology Department • Fellow Capstone Students • Family and Friends


