Download
1 / 14
140 likes | 291 Views
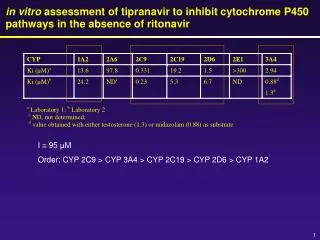
in vitro assessment of tipranavir to inhibit cytochrome P450 pathways in the absence of ritonavir. I 95 µM Order: CYP 2C9 > CYP 3A4 > CYP 2C19 > CYP 2D6 > CYP 1A2.

E N D
in vitro assessment of tipranavir to inhibit cytochrome P450 pathways in the absence of ritonavir I 95 µM Order: CYP 2C9 > CYP 3A4 > CYP 2C19 > CYP 2D6 > CYP 1A2
Study 1182.12: Number of patients taking co-medications that are substrates for cytochrome P450 enzymes that tipranavir inhibits in vitro
Planned in vitro studies • Evaluate induction in human hepatocytes by measuring increases in the relevant proteins, namely CYP3A4, CYP2C9, CYP2B6, UGT, Pgp (MDR1), and MRP2, by quantitative PCR. These results will be compared to data for other relevant protease inhibitors to rank order tipranavir with respect to its induction potency. • Evaluate the possible interaction with the nuclear receptors PXR, CAR and FXR, which are responsible for induction of drug metabolizing enzymes and transporters. Derive EC50 and Emax values using a reporter gene construct assay. Interaction with these receptors will be used to indicate the potential for induction of various drug-metabolizing enzymes and transporters by comparisons with the scientific literature.
Percentage of patients who do and do not develop LFT abnormalities is similar among TPV/r recipients who do and do not develop rash
Onset and Duration of Rash Associated with TPV/r HIV - Negative Trial 1182.22 Trials HIV - Positive (n= 28 ) (n= 9) Trials (n=5 6 ) Time to O nset Range 3 - 14 1 - 10 1 - 582 10.5 4.9 87.5 Mean Median 11 4.0 15.5 Duration of Skin Rash (n=28) (n=9) (n=45) Range 1 - 24 2 - 19 2 - 49 Mean 6.7 8.8 13.5 Median 4.0 10 11 HIV-negative trials: 1182.37, 1182.41, 1182.42, 1182.46 HIV-positive trials: 1182.2, 1182.4, 1182.6, 1182.52
TPV/r Exposure During Pregnancy Source: ARISg query March 22, 2005
Risk of MST Rash Among TPV Recipients in RESIST:CD4 Baseline Fixed logistic regression model among TPV/r recipients in RESIST. Variables shown are all variables tested in the model.
Method Serum shift of IC50 (PNU) Serum shift of IC50 (BI) Equilibrium dialysis (BI) Adjustment Factor 4-fold 3 to 4-fold 3.75-fold Determination of Protein Adjustment Factor
Calculation of Inhibitory Quotient (IQ) • Protein Binding Correction Factor (PBCF = 3.75x) • TPV is highly bound in plasma (99.96 - 99.98%) • Cell culture media only contains 6% fetal bovine serum (99.88%) • PBCF estimated using 2 methods: • Method 1: Equilibrium Dialysis: 0.120% free / 0.034% free = 3.5x • Method 2: Addition of 75% human plasma to antiviral assay resulted in a 4x shift • IQ = Cmin / (IC50 fold WT ● mean WT HIV IC50● 3.75) standardized TPV susceptibility susceptibility in patient isolate PBCF PK
Choice of Pre-selected Protease Inhibitor – RESIST Trials a TruGene®: No evidence of resistance. Virtual Phenotype™: within normal susceptibility range or resistance unlikely; for IDV <= 3.0, for SQV <= 2.5, for APV <= 2.0, and for LPV <10. b TruGene®: Possible resistance. Virtual Phenotype™: for LPV only 10 to <40. c TruGene®: Resistance. Virtual Phenotype™: resistance or resistance likely as defined by being above normal susceptibility range; for IDV >3.0, for SQV >2.5, for APV >2.0, and for LPV >= 40.
Treatment Response at Week 24 by Prior Use of the Pre-selected Comparator PI
Where did L90M Go? • L90M when combined with V82T or I84V was associated with decreased TPV susceptibility in the VIRCO panel of isolates • Combinations of Key mutations which include L90M are associated with decreasing TPV susceptibility and decreased virologic responses to TPV/r • L90M is not included in the TPV Score: • Not selected by TPV exposure in vitro or in clinical HIV isolates • Not associated with TPV phenotype in multivariate analysis of 99 HIV-1 protease amino acids • Not associated with TPV/r antiviral responses in multivariate analyses of 99 HIV-1 protease amino acids • It appears that L90M when combined with mutations at codons 82 or 84 serves as a marker for highly mutated viruses which contain other mutations associated with decreased TPV susceptibility.
Impact of Key Mutations at Codons 33, 82, 84, 90: Baseline Phenotypic Susceptibility all TPV trials 0 1 2 3 4 0 1 2 3 4 0 1 2 3 4 0 1 2 3 4 0 1 2 3 4 0 1 2 3 4 0 1 2 3 4 0 1 2 3 4 Key mutations
TPV/r TPV/APV/r TPV/SQV/r TPV/LPV/r Tipranavir BI 1182.518 Week Viral Load Response 0 -0.2 -0.4 -0.6 HIV RNA (log10 copies) -0.8 -1 -1.2 Single Boosted PI Phase TPV added to LPV/APV/SQV -1.4 0 2 4 6 8 Weeks of Treatment