UVIS results and ring evolution
530 likes | 552 Views
UVIS results and ring evolution. LW Esposito 5 January 2010. Background. Accretion is possible in the Roche zone, where rings are found, but limited by tides and collisions (Canup & Esposito, Barbara & Esposito, Karjalainen & Salo)

UVIS results and ring evolution
E N D
Presentation Transcript
UVIS results and ring evolution LW Esposito 5 January 2010
Background • Accretion is possible in the Roche zone, where rings are found, but limited by tides and collisions (Canup & Esposito, Barbara & Esposito, Karjalainen & Salo) • F ring shows clumps and moonlets (Esposito etal, Murray etal); A ring has propellers (Tiscareno, Sremcevic); Embedded moonlets are elongated (Charnoz) • Self-gravity wakes (Colwell, Hedman) in A,B rings show temporary aggregations • Does the size of aggregates represent an equilibrium between accretion and fragmentation (Barbara & Esposito)?
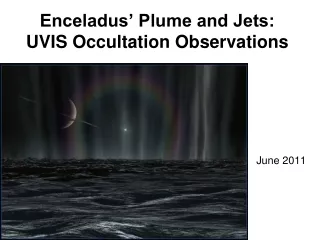
UVIS occultations • UVIS has observed over 100 star occultations by Saturn’s rings • Time resolution of 1-2 msec allows diffraction- limited spatial resolution of tens of meters in the ring plane • Multiple occultations provide a 3D ‘CAT scan’ of the ring structure • Spectral analysis gives characteristics of ring structures and their dimensions
Occultation Analysis • Features in F ring (‘kittens’) • Ring edge thickness and sharpness • Location of F ring core and of B ring edge • Sub-km structure seen in wavelet analysis
Features in F ring • Esposito etal (2008) identified 13 statistically significant features • These were interpreted as temporary clumps and a possible moonlet, ‘Mittens’ • Meinke etal (2009) now catalog 39 features from the first 102 stellar occultations • For every feature, we have a location, width, maximum optical depth (opacity), nickname
Kittens show dependence on Prometheus-relative longitude • Opacity increased in quadrants following Prometheus passage • Linear fit to Prometheus-relative longitude has correlation r = 0.49 • Synodic period is 68 days
Optical depth: leading vs. trailing features trailing leading Longitude relative to Prometheus
Optical depth and means by quadrant (all features) Triangles give quadrant means with standard errors
Ring edge thickness and sharpness • Occultation profile at ring edge gives limits on the edge shape and vertical thickness (Lane etal 1982, Colwell etal 2007) • Edge of Saturn’s B ring (the last 100m before the Cassini Division) shows major time and longitude variability • But, no correlation with Mimas longitude
B ring edge is highly variable • Optical depth is correlated with Mimas location and increasing since 2004 • Edge location intermittently fit by m=2 pattern, with variable phase lag
B ring edge optical depth • Edge profiles exhibit multiple shapes: plains, plateaus, steep hillsides, cliffs, and broad hummocks • Highest optical depth at edge when it is inward of Mimas 2:1 ILR location • Maxima found at 0 and 180 deg co-rotating longitude from Mimas; this is anti-correlated to sub-km structure maxima at 90 and 270 deg from Mimas (see below) • Edge appears to have typical optical depth ~1 present at all times; only recently do certain longitudes show higher optical depths of >2 • Optical depth at edge increases since 2004 in both mean and variance
B ring edge location • Clear, but intermittent m=2 pattern (consistent with VIMS, RSS) • ~2005: amplitude ~100km; minimum leading Mimas by ~45deg • ~2008: amplitude ~150km; minimum trailing Mimas by ~25deg • Weak/hidden/absent m=2 pattern ~2007; A simple drift or libration can not account for all the data • Mimas 2:1 (ILR) is most dominant (m=2 pattern) starting 2008
F ring core and kittens • Unlike the F ring kittens, the F ring core exhibits no trend in optical depth related to Prometheus • F ring core is well-described by freely precessing ellipse to within 50km • Variance of F ring core residuals increases in time as Prometheus and F ring near their anti-apse alignment in December 2009
F ring core perturbed by Prometheus [Albers et al. (2009)]
Sub-km structure seen in wavelet analysis varies with time, longitude • Wavelet analysis from multiple occultations is added in a probabilistic manner to give a significance estimate • For the B ring edge, the significance of features with sizes 200-2000m increases since 2004; and shows maxima at 90 and 270 degrees ahead of Mimas • For density waves, significance correlated to resonance torque
Observational Findings • F ring kittens more opaque trailing Prom. • B ring edge more opaque leading Mimas • Sub-km structure, which is seen by wavelet analysis at strongest density waves and at B ring edge, is correlated with torque (for density waves) and longitude (B ring edge) • Variance in B ring location and in the strength of sub-km structure is increasing since 2004 • The largest structures could be visible to ISS
Conclusions • Cassini occultations of strongly perturbed locations show accretion and then disaggregation: scales of hours to weeks • Moons may trigger accretion by streamline crowding (Lewis & Stewart); which enhances collisions, leading to accretion; increasing random velocities; leading to more collisions and more accretion. • Disaggregation may follow from disruptive collisions or tidal shedding
Summary • Like the global economy, the rings may not have a stable equilibrium for accretion; instead, boom/bust triggered by stochastic events? • The year 2009 showed increased structure in both B ring edge and the F ring : this would be a good time to look for embedded objects
Optical depth of all features by quadrant (outliers excluded) Triangles give quadrant means with standard errors
Optical depth by quadrant (all radial outliers > 100km excluded)
Edge location with corotating longitude (all seasons)
F ring kittens and core Diamonds: kittens Triangles: core
Mechanisms • Collisions may cause stochastic events: compress unconsolidated objects, trigger adhesion or bring small pieces into contact with larger or higher-density seeds • The ring system may resemble a non-linear driven oscillator: moon forcing can drive it out of resonance into chaotic response (works for B ring edge, density waves, but not necessarily for F ring..?)