Download
1 / 37
370 likes | 608 Views
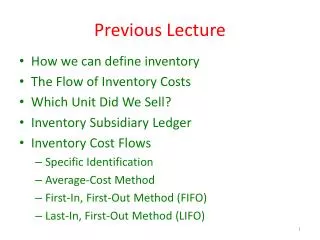
Previous Lecture. How we can define inventory The Flow of Inventory Costs Which Unit Did We Sell? Inventory Subsidiary Ledger Inventory Cost Flows Specific Identification Average-Cost Method First-In, First-Out Method (FIFO) Last-In, First-Out Method (LIFO). PRINCIPLE OF CONSISTANCY.

E N D
Previous Lecture • How we can define inventory • The Flow of Inventory Costs • Which Unit Did We Sell? • Inventory Subsidiary Ledger • Inventory Cost Flows • Specific Identification • Average-Cost Method • First-In, First-Out Method (FIFO) • Last-In, First-Out Method (LIFO)
The Principle of Consistency Once a company has adopted a particular accounting method, it should follow that method consistently, rather than switch methods from one year to the next.
Just-In-Time (JIT) Inventory Systems This inventory arrived just in time for us to use in the manufacturing process.
Just-In-Time (JIT) Inventory Systems Although a just-in-time system reduce the size of a company’s inventories, it does not eliminate them entirely. A recent annual report of Dell Computer Corporation, for example, showing inventories in excess of $273 million (Dell report its inventories by the FIFO method)
Taking a Physical Inventory The primary reason for taking a physical inventory is to adjust the perpetual inventory records for unrecorded shrinkage losses, such as theft, spoilage, or breakage.
Obsolescence Lower of Cost or Market (LCM) LCM and Other Write-Downsof Inventory Reduces the value of the inventory. Adjust inventory value to the lower of historical cost or current replacement cost (market).
Lower-of-Cost or Market An assets is an economic resources. It may be argued that no economic resource is worth more than it would cost to replace that resource in the open market For this reason, accountants traditionally have valued inventories in the balance sheet at the lower of its (1) cost (2)market value.
Goods In Transit A sale should be recorded when title to the merchandise passes to the buyer. F.O.B. shipping point title passes to buyer at the point of shipment. F.O.B. destination point title passes to buyer at the point of destination. Year End
Periodic Inventory Systems In a periodic inventory system, inventory entries are as follows. Note that an entry is not made to inventory.
Periodic Inventory Systems In a periodic inventory system, inventory entries are as follows.
Periodic Inventory Systems The inventory on hand and the cost of goods sold for the year are not determined until year-end.
Average cost Specific identification FIFO LIFO Periodic Inventory Systems We use one of these inventory valuation methods in a periodic inventory system.
Specific Identification – Example By reviewing actual purchase invoices, Computers, Inc. determines that the 1,200 mouse pads on hand at year-end have an actual total cost of $6,400. Determine the cost of goods sold for the year.
Specific Identification – Example Cost of Goods Sold $9,725 - $6,400 = $3,325
Total Cost of Goods Available for Sale Total Number of Units Available for Sale Average-Cost Method The average cost is calculated at year-end as follows: ÷
Average-Cost Method – Example Avg. Cost $9,725 1,800 = $5.40278 Ending Inventory Avg. Cost $5.40278 1,200 = $6,483 Cost of Goods Sold Avg. Cost $5.40278 600 = $3,242
Oldest Costs Recent Costs First-In, First-Out Method (FIFO) Costs of Goods Sold Ending Inventory
FIFO – Example Remember: Start with the 11/29 purchase and then add other purchases until you reach the number of units in ending inventory.
FIFO – Example Now, we have allocated the cost to all 1,200 units in ending inventory. Now, let’s complete the table.
FIFO – Example Completing the table summarizes the computations just made.
Recent Costs Oldest Costs Last-In, First-Out Method (LIFO) Costs of Goods Sold Ending Inventory
LIFO – Example Remember: Start with beginning inventory and then add other purchases until you reach the number of units in ending inventory.
LIFO – Example Now, we have allocated the cost to all 1,200 units in ending inventory. Next, let’s complete the table.
LIFO – Example Completing the table summarizes the computations just made.
Importance of an Accurate Valuation of Inventory An error in ending inventory in a year will result in the same error in the beginning inventory of the next year.
For interim financial statements, we may need to estimate ending inventory and cost of goods sold.
Determine cost of goods available for sale. Estimate cost of goods sold by multiplying the net sales by the cost ratio. Deduct cost of goods sold from cost of goods available for sale to determine ending inventory. The Gross Profit Method
In March of 2003, Chemico’s inventory was destroyed by fire. Chemico’s normal gross profit ratio is 30% of net sales. At the time of the fire, Chemico showed the following balances: Gross Profit Method – Example
Inventory Turnover Rate Measures how quickly a companysells its merchandise inventory. Average Inventory = (Beg. Inv. + End. Inv.) ÷ 2 A ratio that is low compared to competitors suggests inefficient use of assets.
Average # of days to sell inventory It tell us the number of days required for the company to sell its inventory. Days in the years/Inventory turnover = XXX Days
Example Inventory turnover Rate $23 billion/$5.6 billion = 4.1 times Average # of days to sell inventory 365 days/4.1 times = 89 days
Accounting Methods Can Affect Analytical Ratios Remember that identical companies that use different inventory methods (e.g., FIFO and LIFO) will have different inventory turnover ratios.
End of Chapter 8 Careful! If youdrop the inventorywe will have anotherwrite down.