Download
1 / 19
190 likes | 324 Views
29 July 2008 “ Towards a More Economically Sustainable Blue Mountains ”. Key Directions:. 25 Year Vision for the City Towards a more sustainable Blue Mountains. Working and Learning. Outcomes:. The local economy is strengthened and diversified. Blue Mountains is a model for

E N D
29 July 2008 “Towards a More Economically Sustainable Blue Mountains”
Key Directions: 25 Year Vision for the City Towards a more sustainable Blue Mountains • Working and Learning Outcomes: • The local economy is strengthened and diversified • Blue Mountains is a model for • sustainable business and industry
“I think of the Mountains as a place I leave. I leave to go to uni, I leave to go out at night, I leave to go shopping, I’ll have to leave to get a job and I will probably have to leave to buy a house. What I would hope for the younger people of 2025 is a place where they can stay in to do more things.”Young Blue Mountains Resident
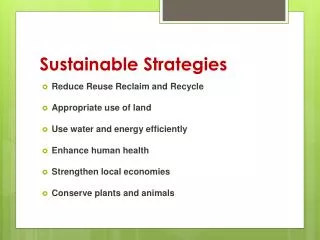
What is Needed to Develop a Better Economic Future? • Identify appropriate strategies to create economical development & jobs • Strategies need to be resourced
Blue Mountains City Population vs Sydney (2001) Blue MountainsSydney SD 12.3% people > 65years
Population Growth in the Blue Mountains 0.6% average annual growth projected to 2026
Unemployment Rate Source: Lawrence Consulting
Gross Regional Product Source: Lawrence Consulting
Gross Regional Product - $1,586.3m 2006/07 Source: Lawrence Consulting
Gross Regional Product – Annual Industry Growth Source: Lawrence Consulting
Gross Regional Product Source: Lawrence Consulting
Total 5,652 Businesses (actively trading & registered for GST) Source: Lawrence Consulting
Businesses by Turnover 50% < $100k 5.8% > $1m Source: Lawrence Consulting
Average Turnover all Businesses $389,000 Finance & Insurance…......................$1,109 Retail………………....................…..$546 Accom. Cafes, Restaurants…………$730
Businesses by Workforce Size Ave Workforce size ….. 3.2 Accom. Cafes/Rest. …13.0 Source: Lawrence Consulting
Index of Economic Diversity Source: Lawrence Consulting
What Could the Better Future Forum Deliver? • Developing business clusters and incubators to assist energising business • Developing business parks & industrial centres • Closer more synergistic working relationships with adjoining local areas • Considering the need for economic development committees/structures • Actively attracting industry that is complementary to our • World Heritage environment
“I think of the Mountains as a place I stay. I stay to go to uni, I stay to go out at night, I stay to go shopping, I don’t have to leave to get a job and I will probably buy a house here.”