Download
1 / 29
290 likes | 400 Views
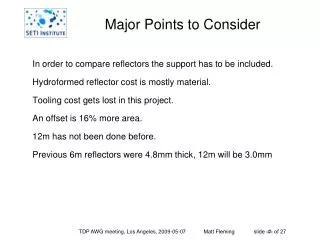
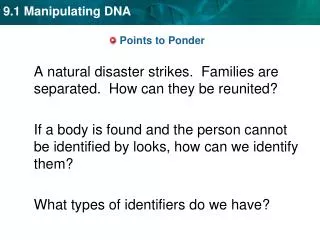
Assessments to VAM to VAS to EES Points. July 28, 2014. Which assessments to include?. Science 7 = a + b 1 (Math 6 ) + b 2 (Reading 6 ) + b 3 (Math 5 ) + b 4 (Reading 5 ) + c(Proportion) + e. Who’s in each model?.

E N D
Assessments to VAMto VASto EES Points July 28, 2014
Which assessments to include? Science7 = a + b1(Math6) + b2(Reading6) + b3(Math5) + b4(Reading5) + c(Proportion) + e
Who’s in each model? • Models are developed by course group. A teacher is assigned a course group based on the course code of the courses they teach. • A teacher can be in more than one course group (e.g. 5th grade math and 5th grade reading, or Algebra 1 and Geometry). • Course groupings help mitigate against bias that may result from an unequal distribution of assessment difficulty and/or student type.
Nomenclature • Coding • t = the current assessment occasion; • t-1 = the prior assessment occasion; • t-2 = the prior assessment occasion to t-1; • SS = Scale score • M Math, R = Reading, Sci = Science. • . denotes class/teacher mean; • .. Denotes the grand mean (usually by course group • E.G. SSMt = the current scale score in Math for an individual student. • E.G. SSMt. = the current scale score in Math for an individual student.
Preparing the data • Step 1: • Normalize the scale scores to a common year (2012); NSSMt = SSMt – SSM2012../SDM2012 • Where SD = Standard Deviation • N = Normalized.
Preparing the data • Step 2: • Link every student’s current score to the Conditional standard error of measurement (CSEM). • Step 3: • Use the Structure table to ensure the proper prior scores are linked to each student’s current (outcome) score.
The Base file (for 2012 7th grade Biology) Each row is a student Multiple rows will form a teacher’s class.
Each row is a teacher • Step 4: • The Base file is aggregated by teacher.
Step 5: • This step could be carried out by many different statistical software applications, but the PED uses HLM. • HLM has a couple of benefits: • It converges quickly (we ran about 120 VAMs) • Output file efficiently provides necessary results for EES.
The basic Model • The outcome variable is NSSSCIT Summary of the model specified • Level-1 Model NSSSCITij = β0j + rijLevel-2 Model β0j = γ00 + u0jMixed Model NSSSCITij = γ00 + u0j+ rij -> in English = a student’s 7th grade Biology score is a function of the grand mean, of all 7th grade biology scores, a unique contribution of teachers and a random component. • This is a mixed effects model. • There are both fixed and random effects. • Teacher VAS are based on random effects. • This is the unconditional model. • It is always the first step in VAM modeling.
Final estimation of fixed effects: Final estimation of variance components
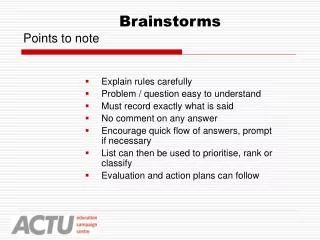
Note: although a “full” model is used to calculate a teacher’s VAS, we will start with the simple model to demonstrate the steps. • Step 6: • Use HLM results to calculate a teacher’s unique contribution to student learning (VAS). • Obtain the OLS residual = Observed – expected.
OLS ResidOLS = .768 – (-.005) = .773. Expected OLS Residual Observed
Step 7: • Consider the reliability of each teacher’s estimate reliability = variance of true scores variance of observed scores l = t00/(t00+s2/nj) • Calculate the Empirical Bayes (EB) estimate using the Kelley equation.
Reliability of Estimates • Reliability depends on the degree to which the true underling parameters vary among groups (e.g. schools). • Classical test theory notion is that reliability = variance of true scores variance of observed scores l = t00/(t00+s2/nj)
Step 7 continued • The Kelley equation: bEB = bols(l) + Y(1- l)
ResidEB = .768(.97) + -.005(1-.97) = .751. OLS Residual EB Residual Reliability
EB Residual |residualols| > |residualEB|; |.773| > |.751| , Which is why this is termed a “shrunken estimate.” The EB residual is a teacher’s VAS.
Step 8: • We normalize VAS scores so that results from all course groups (and assessment types, e.g. EoC, Dibels, etc) will be on the same scale. • VASnormalized = (VAS –VAS..)/SDVAS VAS.. is calculated for each Course group. • And where applicable, by course group by grade. • E.g. VASnormalized = .751 – (-.005)/.4896 = 1.54.
This Teacher’s VAS of 1.54 places him/her in the Highly effective range.
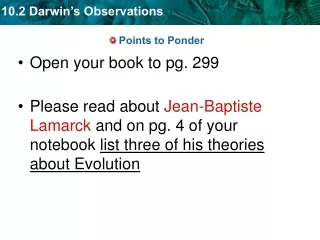
Step 9: • Converting VAS scores into EES points. • Given the normalization in the previous step, we take the normal CDF of the VAS: • In excel this is =NORMSDIST(VAS). • And results in:
VAS to Points Conversion VAS = 1.54
Notes: • The differences between an actual VAS calculation and the example: • Prior achievement (etc) is included in the student level model. • Peer effects are included (e.g. class average prior math and reading achievement). • The level 2 (teacher level) model determines what the EB estimates will be shrunk towards (in the previous example this was the grand mean because there were no level 2 predictor variables, but for the EES, it includes peer effects).
Notes continued: • The actual VAM utilizes the CSEM to eliminate potential relationships between the predictors and the VAS, as well as to help guard against the impact of outliers (extreme test scores). • A teacher’s VAS in the Summative Report is the weighted Average of all the available VAS scores for a teacher. • The weights are the number of students that contributed to a VAS score (which may not equal enrollment ). • This can consist of multiple VAS scores per year and multiple years.
TotVAS_all = value in Summative report and used to calculate points = .76*36 + 1.26*48 + 1.04*19 = 107.6/103 = 1.04.
VAS score for teacher with unconditional VAS of .751 is • .170 using full model and is • 1.18 when normalized. • This = 61.9 points assuming 70 points possible in STAM 1.
How about Excel? There is no guarantee that this method will provide a close approximation of the actual VAS score – however, the sign and magnitude should provide some approximation. A regression for each teacher will result in a VAS of 0.