Download
1 / 33
330 likes | 463 Views
An Examination of the Geographic Aggregation of Catastrophic Risk*. Randy Dumm, Florida State University Mark Johnson, University of Central Florida Charles Watson, Watson Technical Consulting 2013 CICIRM Meeting Kunming, China.

E N D
An Examination of the Geographic Aggregation of Catastrophic Risk* Randy Dumm, Florida State University Mark Johnson, University of Central Florida Charles Watson, Watson Technical Consulting 2013 CICIRM Meeting Kunming, China • *Based on a research project funded by the Florida Catastrophic Storm Risk Management Center at Florida State University
Catastrophic Exposures and Risk Bearing • Earthquake • California but much broader exposure • Tidal Wave/Tsunami • Windstorm and Storm Surge • Hurricane/Tornadoes • Coastal and Inland • Flood • Rainfall driven • Wind driven- Storm Surge • Tsunami • Terrorism • Pandemics • Catastrophes and Risk Bearing (U.S.) • State: Private market, E&S, Residual market • Federal: Flood, Terrorism (ex-post financial support) 2013 CICIRM Meeting
Federal Catastrophe Fund • Proponents • Financial strength of federal government • Pool risks that are uncorrelated or have low correlation • Eliminate or reduce market dysfunctions • Coverage availability • Prompt claims payments • Eliminate or reduce underinsurance problem • Feds provide support ex-post anyhow! • Opponents • Intrusion into private market • Concerns about governmental inefficiencies (e.g., NFIP performance) • Verification and triggers • “Why should [INSERT YOUR STATE HERE] pay for California earthquake losses/Florida hurricane losses/Texas hurricane losses/New York –New Jersey wind and flood losses??” • The subsidy problem • Path to unwanted federal regulation of insurance 2013 CICIRM Meeting
Motivation • Public policy debate about shifting additional catastrophic risk to the federal level • ongoing and often contentious • Little in the way of empirical analysis • Research Questions: • Do diversification benefits exist by aggregating catastrophic loss over larger geographic areas? • If so, when and to what degree do these benefits exist? • First Phase of Research • Catastrophic Wind and Related Exposures (Coastal) 2013 CICIRM Meeting
Selected Literature Review on Geographic Diversification • Lin and Wen (NAAJ, 2012) • Relationship between ERM adoption and reinsurance or geographic diversification. • Klein and Wang (JRI, 2009) • Catastrophic risk financing in the US and EU • Harrington (JRI, 2009) • Financial crises and systemic risk • Klein and Krohm (JIR, 2008) • Jaffeeand Russell(JRI, 1998) 2013 CICIRM Meeting
Impact of correlation on PML Plot of the sum of the probability of two variables (each from 0 to 1) with correlations of 1.0 (black), 0.5 (green), and 0.0 (red). This corresponds to two points located at the same location, then two points close enough to be impacted by some but not all events, and finally far enough apart to be unaffected by the same events. Events (100,000) vs. cumulative “losses” 2013 CICIRM Meeting
Overview of Hurricane Loss Models Input data bases Wind Models Surface Friction and Topography Adjustments Damage Functions Frequency of occurrence of events 2013 CICIRM Meeting
Traditional Loss Models Frequency Model Land Cover Topography Data Exposure Data Historical Storm Data Storm Set Wind Model Friction Model Damage Function Actuarial Module Loss Costs Historical data can be used directly, statistically smoothed, or otherwise analyzed to create a data base of storm characteristics used to create the storm set for simulations. 2013 CICIRM Meeting
Methodology • Simulate all Atlantic storms (1851 to 2011; only using 1871 to 2011 for analysis • Run full physics tropical cyclone model • SLOSH wind model with trajectory based boundary layer • WISWAVE III wave model (incl. inshore refraction/breaking) • 5 layer hydrodynamic model (storm surge and riverine flooding) • TRMM Climatology based rain model. • Determine losses on target portfolio • Composite of multiple public domain damage functions (Watson and Johnson, 2004) • Modeled loss costs include wind (TS+), riverine flooding, and storm surge 2013 CICIRM Meeting
Terminology and Comparison Criteria • Average Annual Loss (AAL) • Probable Maximum Loss (PML) • Return period and frequency • PML/AAL • Multiples of the annual premium that are required to cover the losses from an event of that return period • Plot: PML/AAL to Return Period 2013 CICIRM Meeting
Variability and Uncertainty • Variability: What is the range of probable risk in a given year? In catastrophic risk this can be an enormous range – from zero to a large number. We usually look at this in terms of return periods, such as the 100 year event, or in annual terms, an event has a 1 in 100 chance of happening in a given year. • Uncertainty: How good are the estimates of the risk? 2013 CICIRM Meeting
Experimental Results Hypothetical exposure at each ZIP Code centroid:Structure Value: $100,000Contents Value: $60,000Standard US Single Family Construction (WF) 2013 CICIRM Meeting
Case 1: Single Location Aggregating to zip code level 2013 CICIRM Meeting
Case 2:Single Structure Combinations 2013 CICIRM Meeting
Case 3: Multi-County Combinations 2013 CICIRM Meeting
Realistic Exposure Results Exposure derived from 2010 American Community Survey at the Block Group level. 2013 CICIRM Meeting
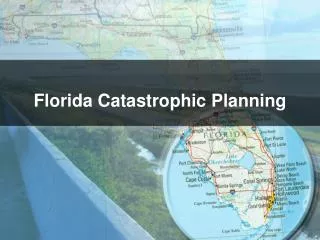
Florida ACS Exposure Pushpins are ZIP Codes Green dots are ACS BG Centroids ACS data is approximately 10 times as dense as ZIP Codes are in urban areas geographically. Diverse portfolio – Manufactured Housing, Wood Frame, Masonry, Duplexes, Condos, etc. 2013 CICIRM Meeting
Performance of various Florida Portfolios 2013 CICIRM Meeting
Florida Statewide, Inland and Coastal Portfolios 2013 CICIRM Meeting
Individual States vs. Multi-state Groups 2013 CICIRM Meeting
Uncertainty How good are the loss estimates? This figure shows the range of possible values for the State of Florida (blue shaded area bounded by black lines), and for the entire coast from Texas t o Virginia (pink shaded area bounded by red lines). In both cases the shaded area represents the upper 90% and lower 10% prediction limits. In other words, there is a 10% chance the correct value is above the shaded area, and a 10% chance the correct value is below the shaded area. 2013 CICIRM Meeting
Capacity required to cover a 100 year Loss 2013 CICIRM Meeting
Main Results • Clear benefit of pooling catastrophic wind risk more broadly • Geographic diversification benefits for the less frequent/more severe events • > 20-25 year return period • 54% of individual aggregate • Benefit would accrue to all state combinations examined in this study. • Natural boundaries instead of state borders • Results are independent of premium: No subsidy issue • Model transparency should help to address black box concerns • Modeled loss results include storm surge 2013 CICIRM Meeting
Implications and Future Direction • Pooling implications • Two Tier System • Multi-state (coastal) compact, national wind risk pools • Challenges • Need for long-term perspective • AALs across time • Year to year variation in experience across states • Triggers and Managers • Future Direction • Additional analysis related to diversification benefits • Evaluate whether geographic diversification benefits exists for pools with different catastrophic exposures (i.e., wind, earthquake, flood). • Catastrophic Storm Risk Management Center • www.strormrisk.org 2013 CICIRM Meeting
Hurricane Modeling Background • Traditional methods of projecting hurricane loss cost were considered inadequate after Hurricane Andrew. • Hurricane modeling provided a more scientific approach, but has been considered controversial due to the proprietary nature of the models. • The Legislature recognized the need for expert evaluation of computer models. 2013 CICIRM Meeting
Creation of Florida Commission on Hurricane Loss Project • In 1995, the Florida Legislature created the 11 member Florida Commission on Hurricane Loss Projection Methodology (see s. 627.0628, F.S.) • Administered out of the Florida Hurricane Catastrophe Fund • State Board of Administration annually appoints the Chair • Panel of Independent Experts formed to: • “provide the most actuarially sophisticated guidelines and standards for projection of hurricane losses possible,” • “resolve conflicts among actuarial professionals,” • “provide both immediate and continuing improvement in the sophistication of actuarial methods used to set rates.” 2013 CICIRM Meeting
Composition of the Commission • Three actuaries: • OIR (appointed by Director of OIR) • Insurance Industry (appointed by CFO) • Actuary Member of the FHCF Advisory Council • Experts from the State University System (appointed by the CFO): • Insurance Finance (Actuarial Science) • Statistics (Insurance) • Computer System Design • Meteorology (Hurricanes) • Insurance Consumer Advocate • Executive Director of Citizens • Senior FHCF Officer • Director, Division of Emergency Management • Engineer to join Commission later this year 2013 CICIRM Meeting
Principles (Examples*) • All models or methods shall be theoretically sound. • Models or methods shall not be biased to overstate or understate results. • The output of models or methods shall be reasonable and the modeler shall demonstrate its reasonableness. *See page 15 of the Report of Activities for the 20 Principles adopted by the Commission. 2013 CICIRM Meeting
The Acceptability Process 30 Revising & Developing Standards Reviewing Models Jun Jul Aug Nov Dec Jan Feb Mar Apr May Jun Sept Oct Planning Workshops Report of Activities Modelers Submissions Due Commission Reviews Models Commission Reviews Submissions Professional Team & Staff Conference On-Site Reviews by Professional Team Commission Meeting to Adopt Standards Committee Meetings to Revise Standards 2013 CICIRM Meeting
The Professional Team Inputs Statistics Meteorology Expert Evaluation Requires: Statistician Meteorologist Structural Engineer Actuary Computer Scientist Engineering Actuarial Outputs Computer Programming Hurricane Computer Models 2013 CICIRM Meeting
Requirements 2013 CICIRM Meeting
For More Information • FCHLPM Web Site: • WWW.SBAFLA.COM/METHODOLOGY • RDUMM@FSU.EDU 2013 CICIRM Meeting