Download
1 / 97
970 likes | 1.08k Views
Recent fertilizer price trends are not a pretty picture. ?. The good old days…. Why have fertilizer prices gone up so much ??

E N D
Why have fertilizer prices gone up so much ?? • Fertilizer is a world commodity and global demand for nitrogen, phosphate, and potash increased 14, 13, and 19 % respectively from 2001 to 2006 (mostly increased demand from China, India, and Brazil). U.S. corn acres increased from 78.3 million in 2006 to 93.6 million in 2007 largely because of ethanol production. More corn acres = more fertilizer • 2) Fertilizer industry infrastructure was not prepared for this surge in demand • 3) All transportation costs have increased. • A weak U.S. dollar increased the cost of all imported goods. The U.S. • imports ~ 60% of its nitrogen and over 90% of its potash. • High natural gas prices have driven up the cost of producing ammonia, which results in higher prices for all nitrogen and ammoniated phosphate fertilizer materials. • 6) Major fertilizer companies have posted record profits.
The global potash market became very tight in 2007, due to stronger than anticipated demand for potassium fertilizers and logistical constraints in a few exporting countries. > 80 per cent of mined K is exported ! Importers’ potash stocks were at very low levels. Most producers operated at close to capacity. Total global potash production in 2007 was 55.4 Mt MOP eq., increasing by 14 per cent over 2006. Potash exports in 2007 totaled 45.2 Mt MOP eq., representing an 18 per cent increase over 2006.
P fertilizer production is also geographically concentrated Phosphate ore reserves have been identified in 32 countries worldwide, but economic extraction is more limited. The top three producing countries account for 63 % of world P production while the top 12 account for 93%. The US exports ~ 60 percent of its annual phosphate production.
How is this possible? Nitrogen fertilizer is currently produced in over 80 countries worldwide. Only 25% is traded internationally All countries have access to N2, the dominant gas in the earth’s atmosphere. Energy is the limiting factor.
Top five fertilizer consumers China India United States Brazil Pakistan Top five fertilizer producers China United States Russia Canada India
Top five fertilizer importers United States China Brazil India France Top five fertilizer exporters Russia Canada United States Belarus Germany
China’s high export tax on fertilizers, which ranges from 100 to 135 percent, is designed to keep fertilizer in the country for domestic use More than one-half of the fertilizer used in China is used to grow fruits and vegetables
US fertilizer production and consumption • Top five fertilizer-consuming states: Illinois, Iowa, Ohio, Texas, Indiana. • The fertilizer manufacturing industry is responsible for approximately 33,000 jobs in the United States. • Fertilizer production facilities are located in 34 states. • The U.S. nitrogen fertilizer industry operates production plants in 27 states, the phosphate fertilizer industry operates production plants in 12 states and potash is mined in Michigan, New Mexico and Utah.
New Fertilizer Rules October 2008 Farm Journal In this article Ken Ferrie suggests that the “real cost” of fertilizer can be easily understood by calculating the replacement cost of the N, P and K in harvested crops and then expressing this cost in terms of bushels of yield.For example, 5 years ago, when the price of corn was ~ $2/bushel the cost of replacing the nutrients in 180 bushels of corn was ~ $50. Calculating fertilizer cost $50/acre / $2/bushel = 25 bushels/acre This ratio held relatively constant for over a decade - whether corn sold for $2.38 a bushel or $4.75.
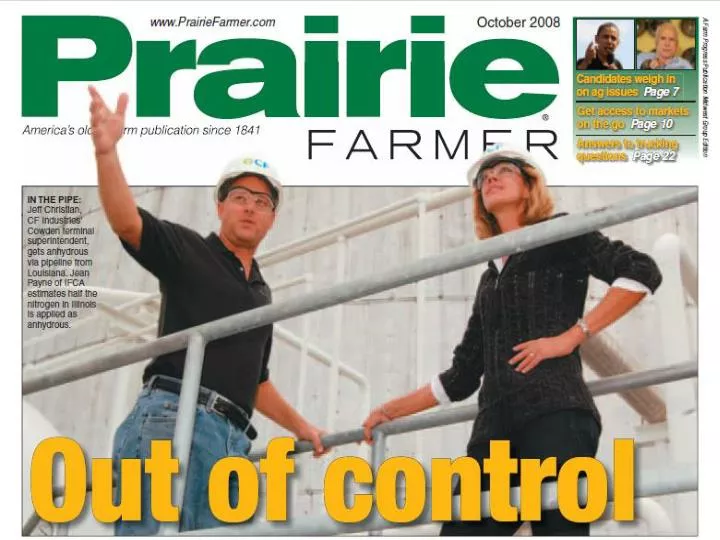
Main concepts in the article 12 anhydrous terminals in Illinois Most are supplied by barge or pipeline Only one terminal is supplied by rail The pipeline is currently at capacity Terminals were built in the late 60s and early 70s. Rail carriers have petitioned for indemnification Retailers have expressed interest in receiving NH3 directly by rail Fall applications are necessary
Ammonia pipelines in the US The pipelines are 8-10 inch diameter, constructed of plain carbon steel, with a total length of approximately 3000 miles.
Relationship between annual N fertilization and N removal in corn grain for 12 states in the USA Corn Belt (1994-2001 averages).
Fertilizer labels • Minimum guaranteed amounts of available N, P2O5 and K2O in fertilizer • 5 – 10 – 30 • N – P2O5 – K2O • Calculated on a % of total weight basis
Illinois law regulates fertilizer analysis, labeling and documentation of sales. http://www.agr.state.il.us/Laws/Regs/fertilizer.pdf
Somewhat flexible interpretation of availability An element is considered "available" if the form in which it is added to the product has been shown to give plant responses or if the element can be dissolved from the product in water or in some other solvent which is recognized to indicate availability to plants.
When claims for such nutrients are made on the label, container, or application for registration, the minimum percentages which will be accepted for registration are as follows: ELEMENT % Calcium (Ca) 1.00 Magnesium (Mg) 0.50 Sulfur (S) 1.00 Boron (B) 0.02 Chlorine (Cl) 0.10 Cobalt (Co) 0.0005 Copper (Cu) 0.05 Iron (Fe) 0.10 Manganese (Mn) 0.05 Molybdenum (Mo) 0.0005 Sodium (Na) 0.10 Zinc (Zn) 0.05 Elements which are guaranteed shall appear in the order listed, immediately following the guaranteed analysis for the primary nutrients, nitrogen, phosphorus and potassium. 1.00-3.00-4.00-Ca17.00--Mg0.40-S3.00--B0.01-Cu0.05-Fe
Warning or caution statements are required on the label for any product which contains 0.03% or more of boron in a water-soluble form or 0.001% or more of molybdenum. When 0.001% or more of molybdenum is added to an agricultural fertilizer, the purchaser is to receive a caution statement as follows: "CAUTION: This fertilizer is to be used only on soils which respond to molybdenum. Crops high in molybdenum are toxic to ruminants."
Fertilizer products are regularly tested in IL http://www.agr.state.il.us/programs/fert2/reports/Spring2007LabTotals.pdf
Fertilizer sales in IL are well documented
Fertilizer sales in IL (fall 2006/spring 07) July – December 2006 42% 56% 56% Majority in the fall January – June 2007 58% 44% 44% Majority in the spring 178,125 1,679,670 2,039,496 168,215 16,564 3,897,293 1,043,307 342,187 569,491 K2O N P2O5 Seasonal totals
K2O and P2O5 fertilizer sales in IL K2O MOP 569,491 tons 99.1 % of material grade 94% of total 15.2% MAP P2O5 DAP 73.8% 342,187 tons 98.6 % of material grade 93.6% of total * (10-30-0, 10-32-0, 10-34-0, 11-33-0, 11-37-0)
N fertilizer materials (tons) MAP 10.5% DAP UAN 22.5% 3.2% Urea AA 55 % 98.8 % of material grade 94.6% of total N 1,043,307 * (10-30-0, 10-32-0, 10-34-0, 11-33-0, 11-37-0)
Joel,This looks to me like a lousy idea being promoted by individuals with vested interests in the ammonia industry. Ammonia is highly toxic, difficult to handle and has a very negative energy balance. As Bob said, using the H directly would be more efficient, but using the wind power electricity directly to charge electric vehicles or hybrids would be more efficient still. Of course, using natural gas directly to power vehicles would be much more efficient that first using it to make NH3. I didn't see anywhere on the website or links that the net energy balance of using NH3 was calculated…
A basic contention is that farmers need new fertilizers that provide a better match between crop growth curves and nutrient availability. Additionally, farmers in the future will need new products to meet stricter Environmental Protection Agency regulations controlling water quality, limiting nitrogen run-off and leaching and air emissions of nitrous oxide and ammonia. There is recognition that farmers will not have the option of ammonium nitrate much longer because of all the restrictions and security measures placed on its manufacture, transport, storage and sale. Anhydrous ammonia could go by the wayside quickly, too, with the right replacement product. Hidden costs and safety concerns are always in the back of retailers and farmers' minds about NH3, but at the moment, knifing in NH3 is a low-cost option for minimum-tillage situations. Because urea and UAN are not stable for surface application, no-tillers and most growers are open to looking at replacement products that don't readily volatilize. New controlled-release nitrogen fertilizers are being developed while other fertilizers are already waiting to take market share once the environmental and economic situation dictates growers switch from conventional fertilizer products. Companies continue to search for alternatives to the big four nitrogen fertilizers---anhydrous ammonia, solid urea, ammonium nitrate and liquid UAN. For the first time, company research is focusing on three fronts simultaneously--environmental impact, yield response and overall economics. "A lot of the work done in the past has only been done looking at one or two of those components, but in today's world they need to look at all three," says Jim Porterfield, special projects research director with the economic analysis team of the American Farm Bureau Federation.