Download
1 / 5
70 likes | 104 Views
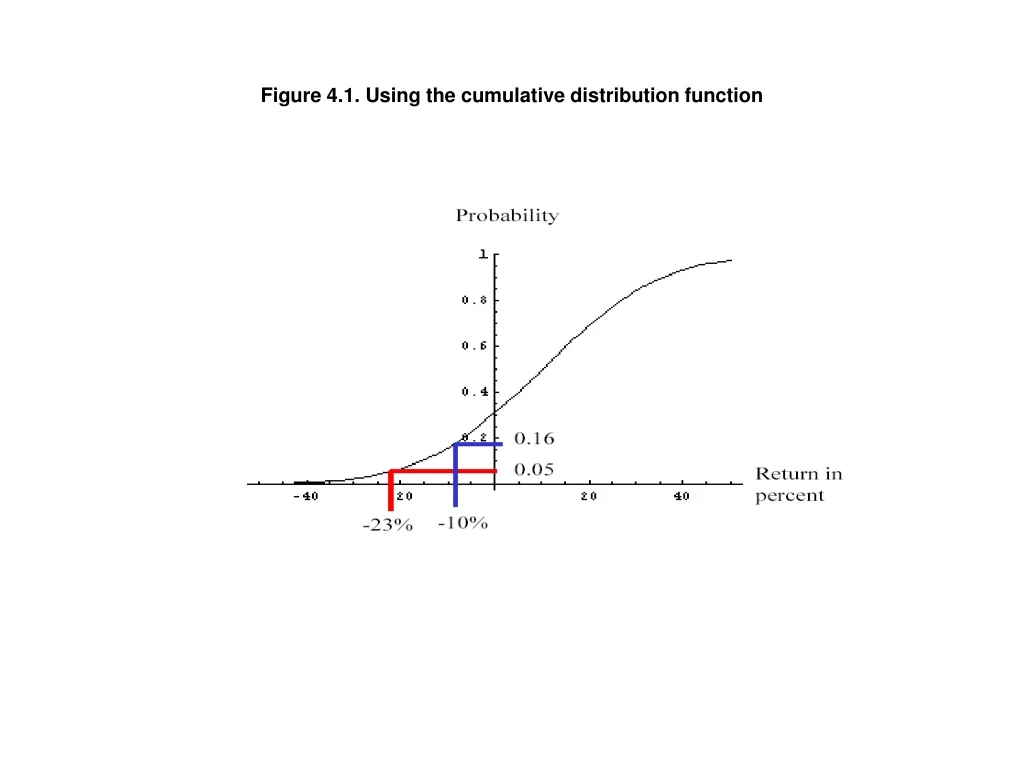
Explore how cumulative distribution functions impact portfolio risk analysis over various time horizons. Analyze density and cumulative distribution functions to assess risk using VaR calculations.

E N D
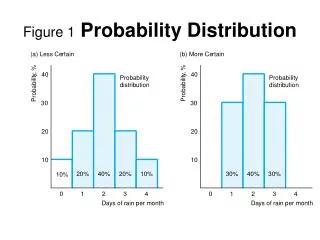
Figure 4.2. Frequency distribution of two portfolios over one year horizon
Figure 4.3. Normal and lognormal density and cumulative distribution functions Panel A. Density distribution functions
Figure 4.3. Normal and lognormal density and cumulative distribution functions Panel B. Cumulative distribution functions
![Cumulative distribution [%]](https://cdn1.slideserve.com/2142714/slide1-dt.jpg)