Download
1 / 9
90 likes | 147 Views
Meeting the Challenges of Energy Demand Karim Barbir SVP Strategy, Portfolio and Risk Management GDF SUEZ Energy North America November 22, 2010. 10. Who is GDF SUEZ ?. Overview 2009 Revenues: €79.9 billion; EBITDA: €14.0 billion; over 200,000 worldwide employees

E N D
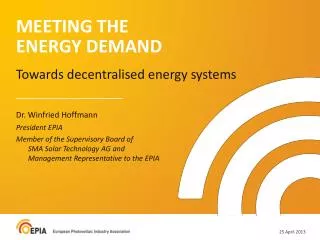
Meeting the Challenges of Energy Demand Karim Barbir SVP Strategy, Portfolio and Risk Management GDF SUEZ Energy North America November 22, 2010
10 Who is GDF SUEZ ? • Overview • 2009 Revenues: €79.9 billion; EBITDA: €14.0 billion; over 200,000 worldwide employees • Electricity: World’s largest IPP • Natural Gas: #1 buyer and transporter in Europe • LNG: #1 importer in Europe and U.S. North American Business • Integrated energy company; 2,000 employees • Electricity: ~8,000 MW in U.S., Canada & Mexico • 23 biomass, wind and hydro-powered assets in US and Canada • Carbon light generation: 21% renewable; 67% gas • LNG: #1 importer in U.S., supply 20% of New England’s annual gas demand • Retail: #2 U.S. electricity retailer servicing commercial & industrial customers • Mexico: #1 private gas transmission; gas distribution to nearly 400k customers
Challenges/Opportunities for North American Energy • Signs of recovery; gas and power demand recovering • Q: Catalyst for growth? • Shale gas advancement • Q: Price impact? • Fuel substitute? • Higher capital costs • Subsidies • Q: Will incentives continue? What/when to invest for clean, affordable and reliable energy? • Drive towards coal retirements • Drive for efficiency • Q: Timing? form?
Economic Recovery Underway… And New Power Generation Will Be Needed US Example Today’s Generation Mix (capacity) Tomorrow Hydro Coal Nuclear • New build considerations • Sustainability • Infrastructure needs • Supply diversity • Price competitiveness 10% Wind; other renew-ables* 10% 31% 4% Oil products 6% 39% Natural gas * Solar, wood, biomass, geothermal Source: EIA
New Generation Build – A Cost Perspective LevelizedCost USD per MWh Carbon Light Carbon Intense Carbon Free Source: GDF SUEZ Energy North America Analysis
Canada Wind Speed Map Renewables- Not Where We Consume Energy Vancouver Montreal United States Solar Intensity United States Wind Speed Map Toronto • Significant incremental transmission will be needed over the next 15 years to integrate renewable development into U.S. generation fleet, • $50 billion to satisfy existing state-level RPS standards • As much as $130 billion to meet a 20% national renewable portfolio standard • Texas PUC, as an example, approved nearly $5 billion for 18,456 MW of transmission investment to support renewable investments Source: NREL, Environment Canada
Shale Gas - N. America’s Answer to a Domestic, Low Cost Primary Energy Source? • Supply: may be as much as 100 years of U.S. consumption by some estimates • New uses: gas-fired power generation to displace coal; petrochemicals return? residential and transportation switching? • Technology adoption: to Europe? Asia? Source: EIA 2010
In a World of Cheap Gas, There is an Expanded Role for Natural Gas Fired Generation Acceptable generation tradeoffs Carbon Light! Competitive Advantages kg CO2 per MWh Coal 1.0 Natural Gas 0.4 • Rapid deployment vs. nuclear • Attractive opex/ capex profile vs. wind and nuclear • High efficiency, off-the-shelf technology A fuel source for the ‘Utility of the Future’ • Flexible generation backup for wind and solar • Electric vehicles
GDF Suez Energy North America- Meeting the Challenges Now • Nuclear as a long-term option- clean, base load generation • Concentrated solar, rooftop solar • Renewables with PPAs • Canada, US, Mexico • CCGT • Hydroand pumped storage • Renewables firm support A diversified, sustainable portfolio profitable under a variety of economic scenarios