Download

1 / 20
210 likes | 388 Views
Manifestation of Novel Social Challenges of the European Union in the Teaching Material of Medical Biotechnology Master’s Programmes at the University of Pécs and at the University of Debrecen Identification number: TÁMOP-4.1.2-08/1/A-2009-0011.

E N D
Manifestation of Novel Social Challenges of the European Unionin the Teaching Material ofMedical Biotechnology Master’s Programmesat the University of Pécs and at the University of Debrecen Identification number: TÁMOP-4.1.2-08/1/A-2009-0011
Manifestation of Novel Social Challenges of the European Unionin the Teaching Material ofMedical Biotechnology Master’s Programmesat the University of Pécs and at the University of Debrecen Identification number: TÁMOP-4.1.2-08/1/A-2009-0011 Erika Pétervári and Miklós Székely Molecular and Clinical Basics of Gerontology – Lecture 3 Nutrition,physical status,body composition, sarcopeniaPart 1
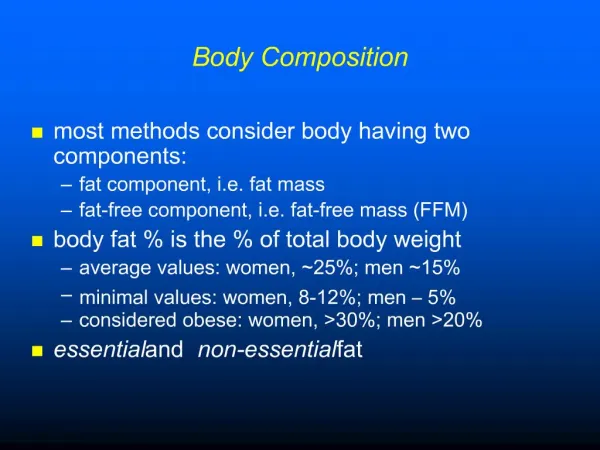
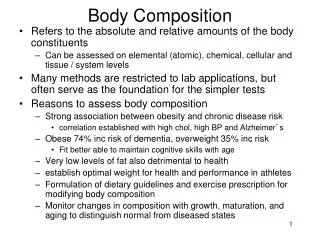
Body composition – energy stores In a healthy young human being: • Adipose tissue: circa 15 kg (130–140,000 kcal) • Protein: around 10-12 kg (35–40,000 kcal) • Carbohydrates: circa 0.3 kg (1,100 kcal) • Water: around 42 kg • Minerals: about 4 kg
Lean body mass (LBM)and • fat mass (FM) • LBMFM • 20-y60+13=73 kg • 70-y48+26=74 kg • Excess weight (if any) = mainly fat(NOT only in fat tissue) • Age-related obesity:fat accumulation in parenchymal cells (muscle, liver) LIPOTOXICITY
Shakespeare: As you like it All the world's a stage, And all the men and women merely players; They have their exits and their entrances; And one man in his time plays many parts, His acts being seven ages. At first the infant, Mewling and puking in the nurse's arms; Then the whining school-boy, with his satchel And shining morning face, creeping like snail Unwittingly to school. And then the lover, Sighing like furnace, with a woeful ballad Made to his mistress' eyebrow. Then a soldier, Full of strange oaths, and bearded like a pard, Jealous in honour, sudden and quick in quarrel, Seeking the bubble reputation. Even in the cannon's mouth. And then the justice, In fair round belly with good capon lin'd, With eyes severe and beard of formal cut, Full of wise saws and modern instances; And so he plays his part. The sixth age shifts Into the lean and slipper'd pantaloon, With spectacles on nose and pouch on side; His youthful hose, well sav'd, a world too wide For his shrunk shank; and his big manly voice, Turning again childish treble, pipes And whistles in his sound. Last scene of all, That ends this strange eventful history, Is second childishness and mere oblivion; Sansteeth, sanseyes, sanstaste, Sanseverything.
Body composition – energy stores Body Fat Ranges for Standard Adults 1 Underfat Healthy Overfat Obese Female 20-39 Age 40-59 60-79 40% 30% 20% 10% 0% Male 20-39 Age 40-59 60-79 Underfat Healthy Overfat Obese Based on NIH/WHO BMI Guidelines.
Changes in body compositionwith age Body weight increases until 60-65, then it starts to decrease 18-55 years 55-65 years 65-80 years • 8-9 kg/decade 1-2 kg/decade -1,-2 kg/decade The body weight of active athletes does not increase. • The fat content of the body increases with age 25 years 75 years 16 – 25 % 28 – 41 % males – females 12 – 15 kg 22 – 25 kg In active athletes the increase is blunted (~young, lean, sedentary). Intensive training decreases abdominal fat. Males have a tendency for visceral fat accumulation, after menopause females too. • Fat free mass (FFM) is stable until 40, then it decreases 25 years 75 years 62 – 46 kg - 3.5 kg decrease/decade, (-3 – -4 %/decade) FFM values and changes are relatively stable with small individual differences. The rate of decrease is similar in athletes.
Adipogenesis and aging Does aging make fat go MAD?(Duringagingcertaincelltypesdegenerate and lipidsaccumulateinnon-adiposetissues.)
Impaired adipogenesis and fat tissue function with aging Fundamental aging processes(reactive oxygen species, telomeres, other) fatty acid handling, glucose metabolism cytokines, cellular stress LIP CHOP C/EBP PPAR Differentiation-Dependent Genes
Fat distribution with aging Preadipocytes Fat in fat depots Osteoblasts Fat outside fat depots Mesenchymal adipocyte-like default (MAD) cells Muscle satellite cells Insulin sensitivity Macrophages Cytokines (TNFα, IL-6) Other mesenchymal cells AGING
Peroxisomeproliferator-activating receptor g (PPAR g) FABPfatty acid binding protein UCPuncoupling protein LXRaliver-X-receptor-a ABCA1ATP-binding cassette A1 PDK4pyruvat-dehydrogenasekinase,isoenzyme 4 PEPCKphosphoenolpyruvat-carboxykinase Adipose FA storage (FABP) FA oxidation (UCP3) FFA Liver gluconeogenesis (PEPCK) PPAR FFA Muscle glucoseoxidation (PDK4) FA oxidation (UCP3) Macrophage oxLDLuptake(CD36) CH efflux (LXR and ABCA1) insulin sensitization glucose lowering triglyceride lowering antiatherosclerotic antihypertensive
Fat metabolism cAMP activated prot.kinase ac CoAcarboxylase inhibition LEPTIN carnitin palmitoyl acyl transferase activation FA OXIDATION FA transfer to mitoch.
Fat, muscle and aging Fat mass Male Female 18-y 18% 33% 85-y 36% 44% Muscle mass 20-40% loss SARCOPENIA
Body weight andadiposity index in rats 600 500 400 Body Weight or Adiposity Index 300 Body Weight Adiposity Index 200 100 3 12 18 24 30 Age (mo)
“Optimal” and real rise of bodyweightin a 30-y period “Optimal”4.5 kg rise (<6%) (30-y period) RealityWhite male9.7 kg mean BMI ~30 or >30 Black male 10.1 kg (n = 16,000) White female 12.0 kg Black female 20.8 kg
Body Mass Index Body Weight (kg) Height (m)2 = 20-25
Bodyweight change (course of 9y) AGE at start BW-change MALE FEMALE 25–45-y + 3.4% + 5.2% 45–65-y no ch. no ch. 65–75-y - 4.1% - 6.3%
U-shaped relationship betweenBMI and mortality ratio >210 190 170 150 130 110 90 70 Men’s mortality ratio (× 100) 50 15 18 21 24 27 30 33 36 39 >210 190 BMI associated with lowest mortality(nadir of curve) Age group BMI 20-29 21.4 30-39 21.6 40-49 22.9 50-59 25.8 60-69 26.6 170 150 130 110 90 70 50 15 18 21 24 27 30 33 36 39 15 18 21 24 27 30 33 36 39 Body Mass Index (kg/m2)
The effect of age on the BMI associated with the lowest mortality 28 The regression lines were computed separately for men and for women. Note that there is a strong effect of age on the BMI associated with the lowest mortality and that the regression lines for men and women are nearly identical. 26 24 Body Mass Index (wt/ht2) 22 20 18 20 30 40 50 60 70 Age (yrs)
BMI associated with the lowest mortality Increased proportion of fat (♂ 36%, ♀ 44%) Height ! Normal values may be different (calculations?)