Download
1 / 1
10 likes | 128 Views
Performance of Splunk for the TDAQ Information Service at the ATLAS experiment. Yoshiji Yasu and Andrei Kazarov on behalf of the TDAQ collaboration. Y. Yasu is with the High Energy Accelerator Research Organization, Tsukuba, Japan (telephone: +81298645384, e-mail: Yoshiji.Yasu@kek.jp ).

E N D
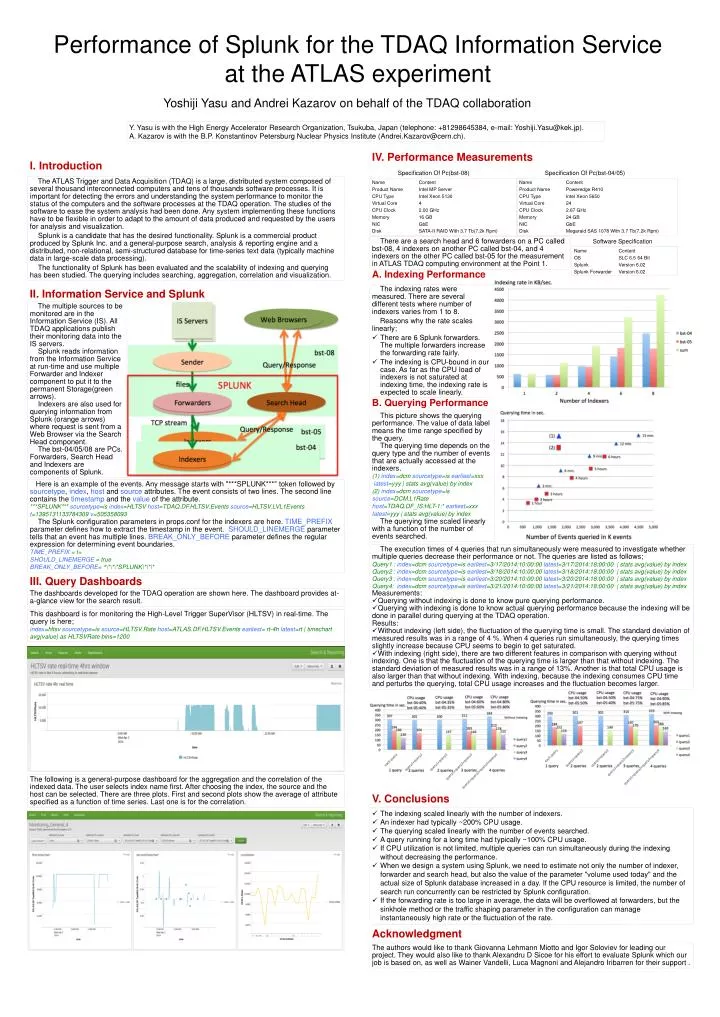
Performance of Splunk for the TDAQ Information Service at the ATLAS experiment Yoshiji Yasu and Andrei Kazarov on behalf of the TDAQ collaboration Y. Yasu is with the High Energy Accelerator Research Organization, Tsukuba, Japan (telephone: +81298645384, e-mail: Yoshiji.Yasu@kek.jp). A. Kazarov is with the B.P. Konstantinov Petersburg Nuclear Physics Institute (Andrei.Kazarov@cern.ch). IV. Performance Measurements I. Introduction Specification Of Pc(bst-08) Specification Of Pc(bst-04/05) The ATLAS Trigger and Data Acquisition (TDAQ) is a large, distributed system composed of several thousand interconnected computers and tens of thousands software processes. It is important for detecting the errors and understanding the system performance to monitor the status of the computers and the software processes at the TDAQ operation. The studies of the software to ease the system analysis had been done. Any system implementing these functions have to be flexible in order to adapt to the amount of data produced and requested by the users for analysis and visualization. Splunk is a candidate that has the desired functionality.Splunk is a commercial product produced by Splunk Inc. and a general-purpose search, analysis & reporting engine and a distributed, non-relational, semi-structured database for time-series text data (typically machine data in large-scale data processing). The functionality of Splunk has been evaluated and the scalability of indexing and querying has been studied.The querying includes searching, aggregation, correlation and visualization. Name Content Product Name Intel MP Server CPU Type Intel Xeon 5130 Virtual Core 4 CPU Clock 2.00 GHz Memory 16 GB NIC GbE Disk SATA-II RAID With 3.7 Tb(7.2k Rpm) Name Content Product Name Poweredge R410 CPU Type Intel Xeon 5650 Virtual Core 24 CPU Clock 2.67 GHz Memory 24 GB NIC GbE Disk Megaraid SAS 1078 With 3.7 Tb(7.2k Rpm) There are a search head and 6 forwarders on a PC called bst-08, 4 indexers on another PC called bst-04, and 4 indexers on the other PC called bst-05 for the measurement in ATLAS TDAQ computing environment at the Point 1. Software Specification Name Content OS SLC 6.5 64 Bit Splunk Version 6.02 SplunkForwarder Version 6.02 A. Indexing Performance • The indexing rates were measured. There are several different tests where number of indexers varies from 1 to 8. • Reasons why the rate scales linearly; • There are 6 Splunk forwarders. The multiple forwarders increase the forwarding rate fairly. • The indexing is CPU-bound in our case. As far as the CPU load of indexers is not saturated at indexing time, the indexing rate is expected to scale linearly. II. Information Service and Splunk The multiple sources to be monitored are in the Information Service (IS). All TDAQ applications publish their monitoring data into the IS servers. Splunkreads information from the Information Service at run-time and use multiple Forwarder and Indexer component to put it to the permanent Storage(green arrows). Indexers are also used for querying information from Splunk (orange arrows) where request is sent from a Web Browser via the Search Head component. The bst-04/05/08 are PCs. Forwarders, Search Head and Indexers are components of Splunk. B. Querying Performance This picture shows the querying performance. The value of data label means the time range specified by the query. The querying time depends on the query type and the number of events that are actually accessed at the indexers. (1) index=dcmsourcetype=is earliest=xxx latest=yyy | stats avg(value) by index (2) index=dcmsourcetype=is source=DCM.L1Rate host=TDAQ.DF_IS:HLT-1:* earliest=xxx latest=yyy | stats avg(value) by index The querying time scaled linearly with a function of the number of events searched. Here is an example of the events. Any message starts with "***SPLUNK***" token followed by sourcetype, index, host and source attributes. The event consists of two lines. The second line contains the timestamp and the value of the attribute. ***SPLUNK*** sourcetype=is index=HLTSV host=TDAQ.DF.HLTSV.Eventssource=HLTSV.LVL1Events t=1395131133784309 v=505358093 The Splunk configuration parameters in props.conf for the indexers are here. TIME_PREFIX parameter defines how to extract the timestamp in the event. SHOULD_LINEMERGE parameter tells that an event has multiple lines. BREAK_ONLY_BEFORE parameter defines the regular expression for determining event boundaries. TIME_PREFIX= t= SHOULD_LINEMERGE = true BREAK_ONLY_BEFORE= ^\*\*\*SPLUNK\*\*\* • The execution times of 4 queries that run simultaneously were measured to investigate whether multiple queries decrease their performance or not. The queries are listed as follows; • Query1 : index=dcm sourcetype=is earliest=3/17/2014:10:00:00 latest=3/17/2014:18:00:00 | stats avg(value) by index • Query2 : index=dcm sourcetype=is earliest=3/18/2014:10:00:00 latest=3/18/2014:18:00:00 | stats avg(value) by index • Query3 : index=dcm sourcetype=is earliest=3/20/2014:10:00:00 latest=3/20/2014:18:00:00 | stats avg(value) by index • Query4: index=dcm sourcetype=is earliest=3/21/2014:10:00:00 latest=3/21/2014:18:00:00 | stats avg(value) by index • Measurements: • Querying without indexing is done to know pure querying performance. • Querying with indexing is done to know actual querying performance because the indexing will be done in parallel during querying at the TDAQ operation. • Results: • Without indexing (left side), the fluctuation of the querying time is small. The standard deviation of measured results was in a range of 4 %. When 4 queries run simultaneously, the querying times slightly increase because CPU seems to begin to get saturated. • With indexing (right side), there are two different features in comparison with querying without indexing. One is that the fluctuation of the querying time is larger than that without indexing. The standard deviation of measured results was in a range of 13%. Another is that total CPU usage is also larger than that without indexing. With indexing, because the indexing consumes CPU time and perturbs the querying, total CPU usage increases and the fluctuation becomes larger. III. Query Dashboards The dashboards developed for the TDAQ operation are shown here. The dashboard provides at-a-glance view for the search result. This dashboardis for monitoring the High-Level Trigger SuperVisor (HLTSV) in real-time. The query is here; index=hltsvsourcetype=is source=HLTSV.Ratehost=ATLAS.DF.HLTSV.Eventsearliest= rt-4h latest=rt | timechartavg(value) as HLTSVRate bins=1200 The following is a general-purpose dashboard for the aggregation and the correlation of the indexed data. The user selects index name first. After choosing the index, the source and the host can be selected. There are three plots. First and second plots show the average of attribute specified as a function of time series. Last one is for the correlation. V. Conclusions • The indexing scaled linearly with the number of indexers. • An indexer had typically ~200% CPU usage. • The querying scaled linearly with the number of events searched. • A query running for a long time had typically ~100% CPU usage. • If CPU utilization is not limited, multiple queries can run simultaneously during the indexing without decreasing the performance. • When we design a system using Splunk, we need to estimate not only the number of indexer, forwarder and search head, but also the value of the parameter "volume used today" and the actual size of Splunkdatabase increased in a day.If the CPU resource is limited, the number of search run concurrently can be restricted by Splunk configuration. • If the forwarding rate is too large in average, the data will be overflowed at forwarders, but the sinkhole method or the traffic shaping parameter in the configuration can manage instantaneously high rate or the fluctuation of the rate. Acknowledgment The authors would like to thank Giovanna Lehmann Miotto and Igor Soloviev for leading our project. They would also like to thank Alexandru D Sicoe for his effort to evaluate Splunk which our job is based on, as well as Wainer Vandelli, Luca Magnoni and Alejandro Iribarren for their support.