Download
1 / 21
210 likes | 355 Views
Using CReSIS Radar Data to Determine Ice Thickness and Surface Elevation at Pine Island Glacier. Team Members: Nyema Barmore Glenn Michael Koch. Team Mentor s : Dr. Sridhar Anandakrishnan Mr. Peter Burkett. Penn State Team Members. Glenn Michael Koch

E N D
Using CReSIS Radar Data to Determine Ice Thickness and Surface Elevation at Pine Island Glacier Team Members: Nyema Barmore Glenn Michael Koch Team Mentors: • Dr. Sridhar Anandakrishnan Mr. Peter Burkett
Penn State Team Members • Glenn Michael Koch • Elizabeth City State University • Nyema Barmore • Elizabeth City State University
Team Mentors • Dr. Sridhar Anandakrishnan • Penn State University • Mr. Peter Burkett • Penn State University
Overview • Abstract • Keywords • Methodology • Conclusion • Future Work
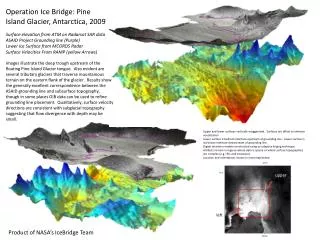
Study Area Pine Island Bay (100° West Longitude - 112° West Longitude)
Abstract The Pine Island Glacier region of Antarctica is an area under intense scrutiny because of its sensitivity to climate change. Pine Island Glacier is located in Western Antarctica and drains a large portion of the West Antarctic Ice Sheet. It has shown to be particularly vulnerable to glacial ablation [1]. The 2012 Research Experience for Undergraduates (REU), Ocean Marine Polar Science (OMPS), Penn State Team analyzed CReSIS radar data to identify the ice-surface and ice-bottom features. From this, both elevation and ice thickness at Pine Island Glacier were determined. The team utilized MATLAB along with an add-on picker program; The Penn State Environment for Seismic Processing (PSESP), developed at Pennsylvania State University. MATLAB is a programming environment that analyzes data as well as many other technical processing applications. With the picker program the team selected specific, maximum-strength radar peaks on individual radar traces and applied a formula to compute the distance traveled by the signal. The difference between the distance traveled from the surface and bottom features was calculated to produce an ice thickness map. The team results will provide data that will aid in modeling of the Pine Island Glacier.
Keywords • Glacier • Radar • Refractive Index • Mass Balance • Calving • Ice-sheet • Topography • Echogram • Picker Program
Methodology • Downloaded radar data files • Downloaded PSESP
Plotted Data Bottom Surface Flipped
Ice Thickness Calculation: [(((Bottom horizon – surface horizon) /10)/2)*170m/uS] Step 1: Take the picker difference value of time between the bottom and surface.Step 2: Divide by 10. This converts it from "samples" to real time (in micro seconds). Step 3: Divide that time by 2. This converts the "two way" travel time (going from the plane to the bottom of the ice and back to plane) into a one way travel time (from the plane to the bottom of the ice).Step 4: Multiply that number by 170 (which converts time to distance because radar waves travel at 170 meters/uS in ice).
Conclusion • Analysis provided numerical elevation data from CReSIS radar data sets that could be plotted and compared to echogram images • Some data sets provide difficulty in human analysis • Data plots did correlate to echogram snapshot images • Data plots provided a reliable source to perform ice thickness calculations
Future Works • Continued Analysis of Data Sets • 3D model • PSESP program modification • Possible combining optical character recognition with PSESP • Option to plot image with the ice surface at the top and bedrock at the bottom