1 / 0

Colleen Roylance Director of Quality and Education

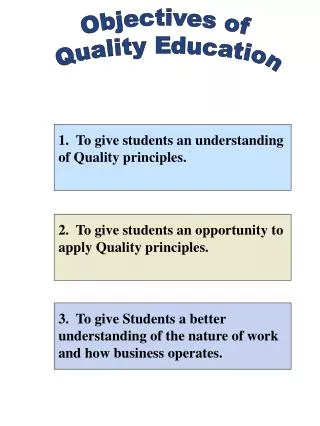
Colleen Roylance Director of Quality and Education. “We are headed into the next century which will focus on quality… ….we are leaving one that has been focused on productivity.”. Dr. Joseph M. Juran 1904 - 2008. Culture of Safety and Quality. QAPI Defined.

gudrun
Download Presentation

Colleen Roylance Director of Quality and Education

An Image/Link below is provided (as is) to download presentation Download Policy: Content on the Website is provided to you AS IS for your information and personal use and may not be sold / licensed / shared on other websites without getting consent from its author. Content is provided to you AS IS for your information and personal use only. Download presentation by click this link. While downloading, if for some reason you are not able to download a presentation, the publisher may have deleted the file from their server. During download, if you can't get a presentation, the file might be deleted by the publisher.

E N D

Presentation Transcript


  1. Colleen Roylance Director of Quality and Education
  2. “We are headed into the next century which will focus on quality… ….we are leaving one that has been focused on productivity.” Dr. Joseph M. Juran 1904 - 2008
  3. Culture of Safety and Quality
  4. QAPI Defined A systematic approach to assessing services and improving them on a priority basis  Customer Focus Employee Empowerment Leadership Involvement Data-Informed Practice Statistical Tools Prevention Over Correction
  5. What it really boils down to… Is this a safe, comfortable place to receive care? Do people feel comfortable speaking up? How do you know?
  6. TaiichiOhno SPC Lean DMAIC W. Edwards Deming CQI Joseph Juran TQM
  7. Lean Six Sigma
  8. Speed 25 Speed 55 Speed 65
  9. Quality Product Features Freedom from Deficiencies That Customers Want Design for Six Sigma At Six Sigma Levels Improve to Six Sigma
  10. What is Lean?
  11. Key LEAN Leverage Points Key Implementation Leverage Points Managers and staff working side by side to solve problems when and where they happen Incremental improvement over and over and over… Eliminate Waste: Eliminate Inefficiency Standardize Work: Eliminate Variation
  12. Voice of the Customer ASK: “What is the customer paying for?” The answer tells you what adds value and you should keep doing OR what doesn’t add value and you should stop doing.
  13. 3 non-value-adding steps x 3 minutes per step x 25 residents x 3 times per day 675 non-value-adding minutes per day / 60 minutes in an hour 11.25 hours per day x 365 day per year 4,106.25 hours per year / 1800 hours in an FTE 2.28 FTEs
  14. 7 Wastes Over production Waiting Motion Inventory Transportation Defects Excess processing
  15. 7 Wastes: Overproduction Doing what is unnecessary when it is unnecessary in an unnecessary amount Example: Setting up meal trays for residents only to learn several residents are gone, thus having to throw out food Solution: Improve communication with direct care and dietary staff Design form or tear-off for kitchen when resident(s) leave facility during meal hour (Common on weekends and during holidays)
  16. 7 Wastes: Waiting Staff: For information, approval, supplies Customers: For assistance, information, supplies, comfort Example: Call light not being addressed and residents waiting for help Solution: Review staffing patterns for timely availability (3 - 5 mins) Staff awareness of high-risk residents – patient safety
  17. 7 Wastes: Motion Movement that is too fast, slow or unnecessary Example: Not having towels and washcloths in AM for staff to assist with residents’ personal hygiene before breakfast Solution: Night shift stocks towels and washcloths during last rounds Place at resident bedside as appropriate
  18. 7 Wastes: Inventory When anything is retained longer than necessary Example: Outdated supplies or medication Solution: Design system so medication/supplements and supplies are checked at least monthly Can be incorporated into night shift duties while stocking medication carts
  19. 7 Wastes: Transportation Transferring or moving unnecessary items and the problems created Example: Supplies are off-loaded at dock  central supply closet  floor supply closet  resident’s room Solution: Solicit supplier to off-load stock to central supply closet Eliminate floor supply closet and stock residents’ rooms
  20. 7 Wastes: Defects Related to costs for inspection of defects Example: Inadequate communication among shifts Solution: Improve communication efforts with TeamSTEPPS handoff tools Provide extra 15 mins between shifts for rounds and questions Utilize standard handoff tool to address resident safety (i.e., weight loss, food intake, skin, falls, behavior)
  21. 7 Wastes: Excess Processing Unnecessary tasks traditionally accepted as necessary Example: Redundant documentation for pressure ulcers – several different forms and/or documentation doesn’t match Solution: Standardize documentation/assessment form Wound/treatment binder Keep binder accessible and include policies and standards
  22. Visual Control Makes abnormalities and waste obvious enough for anyone to recognize Uses standardized control devices, information, color coded layout and signboards Successful leadership depends on visibility of abnormalities
  23. 5S is essential Method of workplace organization Place for everything; everything in its place Reduces wastes due: To clutter Time to find materials and equipment Duplication of equipment Floor space Inconsistency
  24. 5S Sort: Separate the necessary from the unnecessary Simplify: Create a place for everything Sweep: Control the work area visually and physically Standardize: Document agreements made Self-discipline: Follow through and maintain
  25. Standard Operations “Without standard work there can be no improvement.” –TaiichiOhno Standardize the “least waste” way to work Provide low variation in the output Simplifies training, cross training and sharing resources Provides a foundation for improvement
  26. Basic Principles for Lean Specified Activities Outcome Content Sequence Timing Clear Connections Every connection must be direct with an unambiguous yes-or-no way to send requests and receive responses Simple pathways The pathway for every product and service must be as simple and direct as possible
  27. PDSA and A3
  28. Project Planning A straightforward project prioritization tool that effectively ranks projects to ensure the facility is getting the ‘biggest bang for their buck’. Projects are mapped on a spectrum from: Implement immediately Postpone Do not implement
  29. The Power of One Don’t wait for more than one missed opportunity to evaluate the process
  30. Root Cause Analysis: Each Time… Every Time
  31. 5 Whys Problem Statement: The patient was late to the OR; it caused a delay. Why? There was a long wait for a transport bed. Why? A replacement transport bed had to be found. Why? The original transport bed’s safety rail was worn and had eventually broken. Why? It had not been regularly checked for wear. Why? The Root Cause:There is no equipment maintenance schedule. Setting up a proper maintenance schedule helps ensure that patients should never again be late due to faulty equipment. This reduces delays and improves flow. If you simply repair the bed or do a one-off safety rail check, the problem may happen again sometime in the future.
  32. Establish Root Cause(s) A cause and effect diagram, also known as a “fishbone” diagram, is a graphic tool used to explore and display the possible causes of a certain effect.
  33. What Is Failure Mode and Effect Analysis? FMEA is a systematic method of identifying and preventing problems before they occur.
  34. RCA vs. FMEA Similarities Differences Process vs. chronological flow diagram Prospective (what if) analysis Choose topic for evaluation Include detectability and criticality in evaluation Emphasis on testing intervention Interdisciplinary Team Develop Flow Diagram Focus on systems issues Actions and outcome measures developed Scoring matrix (severity/probability) Use of cause & effect diagram, brainstorming
  35. FMEA: Your Crystal Ball
  36. For More Information: Colleen Roylance Director of Quality and Education (406) 457-5874 croylance@mpqhf.org This material was developed by Mountain-Pacific Quality Health, the Medicare quality improvement organization for Montana, Wyoming, Hawaii, Alaska and the Pacific Territories of Guam and American Samoa and the Commonwealth of the Northern Mariana Islands, under contract with the Centers for Medicare & Medicaid Services (CMS), an agency of the U.S. Department of Health and Human Services. Contents presented do not necessarily reflect CMS policy. 10SOW-MPQHF-WY-IPC-13-10
More Related