Download
1 / 25
280 likes | 464 Views
CAPS. CAPACITY OPTIMIZATION PLANNING SYSTEM. INTRODUCTION. Semiconductor integrated circuit manufacturing: Very complex process Hundreds of operations Several hundred sets of tools Price of tools is very high ($1- $10 million) Accurate capacity planning is very critical.

E N D
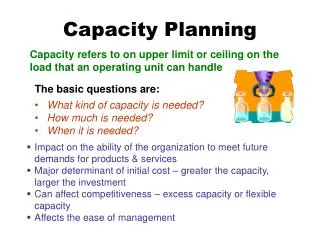
CAPS CAPACITY OPTIMIZATION PLANNING SYSTEM
INTRODUCTION • Semiconductor integrated circuit manufacturing: • Very complex process • Hundreds of operations • Several hundred sets of tools • Price of tools is very high ($1- $10 million) • Accurate capacity planning is very critical
MANUFACTURING PROCESS • Chemical Clean • Oxidation • Photolithography • Chemical Etch • Ion Implant • Metal/Insulator Deposition • Anneal
IBM PROBLEM • Need to plan capacity one year in advance of the expected demand • Find the best product mix with existing capacity • Assessing tool capacity by product mix (a complex process) • Current planning approach not very efficient (spreadsheets, simulations)
CAPS • Helps identify tool capacity required to meet the demand • Helps volume mix of products to maximize profit
IMPLEMENTATION • Solver: IBM Optimization Solutions and Library (OSL) on a Unix server • Graphical User Interface on a PC client • Input data automatically formatted and downloaded from tool-planning database • Variables: 3,500 – 5,500 • Constraints: 1,600 – 2,400 • Products: 1 – 40 • Solution time: 18 – 30 seconds
BENEFITS • Many scenarios can be analysed in hours versus days • 10s of millions of Dollars in savings • Comprehensive reports enabling analysis • Enables a quick utilization of scenarios to maximum capacity
DEFINITIONS • 50 Products, each 400 to 600 operations • Tools; same operations, different speeds • 100s Tool Groups (identical tools) • Parallel, unrelated T.G. • T.G. with common operations: Cascade • T.G. w/o common operations: NonCascade • Identify bottlenecks or gating T.G. • Preferred order of T.G. in C.G.
CASCADE TOOLS TG 1 TG 3 1, 2, 5, 6 9, 10 TG 2 12 1, 2, 3, 4 1, 2, 7, 8 11
NON-CASCADE TOOLS TG 4 TG 5 13, 15, 18, 19 14, 16, 17
MATHEMATICAL MODEL Max s.t.
MINI-CASE • # Cascade Tool Groups = 3 • # Operations in C.G. = 12 (1,…, 12) • # Non-Cascade Tools = 2 • # Operation in N-C.G = 7 (13,…, 19) • # Products = 3 • Available time = 480 Min./Day • # Variables = 306 • # Constraints = 109 • Solution Time < 1.0 Sec.
LIMITATIONS • Does not consider: • Inventory • Stochastic demand