Download
1 / 3
30 likes | 94 Views
GTPu00ae Model on the Application of OECD Transfer Pricing Methods. General description on the Selection of the Most Appropriate OECD Transfer Pricing Method. More details Visit us at tinyurl.com/y67sordv

E N D
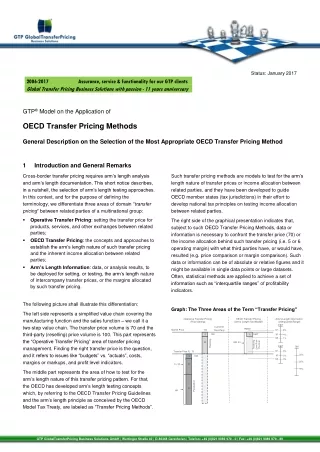
Status: January 2017 2006-2017 Global Transfer Pricing Business Solutions with passion - 11 years anniversary Assurance, service & functionality for our GTP clients GTP® Model on the Application of OECD Transfer Pricing Methods General Description on the Selection of the Most Appropriate OECD Transfer Pricing Method 1 Introduction and General Remarks Cross-border transfer pricing requires arm’s length analysis and arm’s length documentation. This short notice describes, in a nutshell, the selection of arm’s length testing approaches. In this context, and for the purpose of defining the terminology, we differentiate three areas of domain “transfer pricing” between related parties of a multinational group: Such transfer pricing methods are models to test for the arm’s length nature of transfer prices or income allocation between related parties, and they have been developed to guide OECD member states (tax jurisdictions) in their effort to develop national tax principles on testing income allocation between related parties. Operative Transfer Pricing: setting the transfer price for products, services, and other exchanges between related parties; OECD Transfer Pricing: the concepts and approaches to establish the arm’s length nature of such transfer pricing and the inherent income allocation between related parties; Arm’s Length Information: data, or analysis results, to be deployed for setting, or testing, the arm’s length nature of intercompany transfer prices, or the margins allocated by such transfer pricing. The right side of the graphical presentation indicates that, subject to such OECD Transfer Pricing Methods, data or information is necessary to confront the transfer price (70) or the income allocation behind such transfer pricing (i.e. 5 or 6 operating margin) with what third parties have, or would have, resulted (e.g. price comparison or margin comparison). Such data or information can be of absolute or relative figures and it might be available in single data points or large datasets. Often, statistical methods are applied to achieve a set of information such as “interquartile ranges” of profitability indicators. The following picture shall illustrate this differentiation: Graph: The Three Areas of the Term “Transfer Pricing” The left side represents a simplified value chain covering the manufacturing function and the sales function – we call it a two-step value chain. The transfer price volume is 70 and the third-party (reselling) price volume is 100. This part represents the “Operative Transfer Pricing” area of transfer pricing management. Finding the right transfer price is the question, and it refers to issues like “budgets” vs. “actuals”, costs, margins or markups, and profit level indicators. Operative Transfer Pricing (Price Setting) OECD Transfer Pricing (Arm’s Length Test Model) Arm’s Length Information (Interquartile Range) EBIT Customer Third-Party TNMM Market Price 100 Q1 8% OM EBIT 5 % M Q3 4% 1% (Low-Risk / Reselling Reselling Routine) 25 GM 30 EBIT GM Q1 9% Transfer Price P1 70 32% M Q3 5% 3% 6 OM 25% C+ 30 24 19% The middle part represents the area of how to test for the arm’s length nature of this transfer pricing pattern. For that, the OECD has developed arm’s length testing concepts which, by referring to the OECD Transfer Pricing Guidelines and the arm’s length principle as conceived by the OECD Model Tax Treaty, are labeled as “Transfer Pricing Methods”. Production 40 HK 4 GTP GlobalTransferPricing Business Solutions GmbH | Wertinger Straße 40 | D-86368 Gersthofen | Telefon: +49 (0)821 9089 979 - 0 | Fax: +49 (0)821 9089 979 - 89
Operative Transfer Pricing (Price Setting) OECD Transfer Pricing (Arm’s Length Test Model) Arm’s Length Information (Interquartile Range) EBIT Customer Third-Party TNMM Market Price 100 Q1 8% OM EBIT 5 % M Q3 4% 1% (Low-Risk / Reselling Reselling Routine) 25 GM 30 EBIT GM Q1 9% Transfer Price P1 70 32% M Q3 5% 3% 6 OM 25% C+ 30 24 19% Production 40 HK 4 2 Function & Risk Analysis Other methods are: The crucial part of the selection of the (most) “appropriate” OECD Transfer Pricing Method is the function and risk analysis result. This part of a transfer pricing management process is the “switch” for the question of what kind of OECD testing concept best fits to the fact pattern, reflecting the operative transfer pricing situation, on the one hand, and the availability of comparable data and the reliability of such data, on the other hand. Transactional Net Margin Method (TNMM) Residual Profit Split Methods (RPS) Formulary Apportionment (FA) While the transaction-based methods look at the transactional level between related parties, the company-based methods focus on the “entity-level” between related parties. Other methods shall be applied in cases where neither the transaction-based methods nor the company-based methods are usable, be it for the lack of comparable data or for reasons of acceptance in given jurisdictions. For example, in many European companies, CPM or PS are not accepted by the respective legal provisions or by the practitioner opinion of the tax authority in question. Likewise, CostPlus or R- are often not applicable if there is a lack of “comparable data” on the transaction level. Whereas the analyst may have access to the information on the operating margin of the related-party transaction (i.e., left side area in the graph), the transaction- based margin information between third parties is rarely available. We will describe in a different paper the nature of the type of function and risk analysis and its impact on the choice of the arm’s length test model. In general, however, we propose the mechanism that the tested party shall become that unit along the value chain which represents the “simpler” function and risk pattern – as compared with these units of that value chain which are deemed more complex with regard to functions performed, risk borne, and assets deployed. The middle part of the graph above labels the “sales unit” as a “low risk distributor” and, by making use of this result of the function and risk analysis, it represents the so-called “routine” unit of such transfer pricing fact pattern. In the international tax practice, the routine unit usually becomes the tested party and, subject to the availability of comparable data, the arm’s length information is applied to the sales function. More specifically, testing a related-party fact pattern by means of the Cost Plus Method requires not only information on the markup on top of (full) costs of the related-party transaction, but also the markup on (full) costs of a single transaction (or group of transactions) between third parties on the same value chain level (functional step level). Yet observing third- party business as external analysts, we might find the price of such transaction (e.g. a computer is sold from the manufacturer to the wholesale dealer), but we rarely find information on the markups, or margins, behind such transaction. 3 Selection of OECD Transfer Pricing Method To execute the arm’s length test, and in line with the OECD terminology, we differentiate between transaction-based testing models (“transfer pricing methods” = OECD Transfer Pricing Methods) and company-based testing methods. Transaction-based transfer pricing methods are: The same problem of finding comparable information applies to the R- Method. As arm’s length analyst, we might barely be able to identify the gross margin or the operating margin of the reselling function within the value chain, but we hardly can identify such margin allocated within an entity of a third-party reseller for such individual transaction. Comparable Uncontrolled Price Method (CUP) Cost Plus Method (CostPlus) Resale Price Minus Method (R-) Company-based transfer pricing methods are: In other words, arm’s length test mechanisms lack well- structured information on profit margins (or markups) between third parties on the analysis level “transaction”. Likewise, to our knowledge no (publicly available) database exists from which such transaction-based margins could be derived, and made available for the arm’s length test. Comparable Profit Method (CPM) Profit Split Method (PS) GTP GlobalTransferPricing Business Solutions GmbH | Wertinger Straße 40 | D-86368 Gersthofen | Telefon: +49 (0)821 9089 979 - 0 | Fax: +49 (0)821 9089 979 - 89
4 TNMM as Last Resort Method transactional level and, vice versa, the availability of comparable information on the entity level. It is called database-driven arm’s length analysis because commercially available company databases are deployed to identify “comparables”. In international taxation, however, many tax jurisdictions have defined that the “transaction-based” methods are the most preferable arm’s length testing models, and company-based methods are not preferable, or even have to be rejected as testing models. As a consequence, “other methods” might be applicable, and the TNMM approach requests the following two conditions to be fulfilled: The arm’s length information is usually represented by profitability information such as EBIT margins, and in some cases gross margins, of the respective sample of comparable companies. Other profitability indicators, in theory, are likewise imaginable, however the practitioner often lacks sufficient datasets in a sample of, otherwise, comparable companies. Comparability of third-party units can be defined along multiple ways. However, most often the industry, the functional level (e.g. reselling as wholesale unit) and the product comparability are focused on throughout such screening process. If datasets are available in a sufficiently large number, further comparability information can be deployed like size of the company, jurisdictional and market context (country, region), or trade description, etc. The questions whether such company found is dependent (related party) or not, is also a criteria of the screening process. CUP is deemed not applicable because of a lack availability of comparable prices including information on the terms & conditions and the product/service qualities, AND CostPlus and R-cannot be used as arm’s length test model because of a lack of transaction-based margin information. Across the OECD community of transfer pricing experts, the TNMM approach has elaborated as method of last resort because it compares the related-party “transaction-based” profit with third-party profits on the level of “companies” (= legal entities). In general, TNMM actually reflects a hybrid analysis model which, deploying profitability indicators, compares the transaction-based profit situation on the related-party side (see left side of the graph) with company-based profit situations of “third-party” units. For that, the benchmark approach using financial statement information has been developed. Such financial statement information is often publicly available, and/or can be derived from commercially available company databases by applying certain screening steps. 5 Conclusion The set of comparable information used for such TNMM- driven arm’s length test is usually the interquartile range of a given profitability indicator like EBIT. In practice, it is defined that the upper and lower quartile embrace the range of arm’s length profitability, and the median could be understood as a default value of such profitability rate. In some few countries like India, instead of the median it is the arithmetic mean of the sample which is used as arm’s length reference point, expanded by a plus-minus range of, say, x percent points. In practice, the datasets used for such benchmarking approach are derived from financial statements of companies, and, hence, are of the nature of legal-entity information. As a consequence, the profitability of the related-party transaction is compared with the profitability of legal entities. Such comparison reflects an approximation between third-party information and related-party information – in fact, we compare apples with oranges. Altogether, given the lack of information on the transaction level, the TNMM approach is most often the last resort method in the international transfer pricing practice to marry arm’s length information with related party profitability. The former one is always on the legal entity level, the latter one is conceived to be on the transaction level. Be it ex ante in the context of price setting or ex post in the course of establishing arm’s length behavior given actual data of income allocation between related parties, from a global perspective the very large bulk of arm’s length analysis tests are built on this construction of the TNMM approach. And the reason is simply the lack of comparable information on the The RPS (Residual Profit Split model) will be described in a different note. GTP GlobalTransferPricing Business Solutions GmbH | Wertinger Straße 40 | D-86368 Gersthofen | Telefon: +49 (0)821 9089 979 - 0 | Fax: +49 (0)821 9089 979 - 89