Comprehensive OTF Tutorial for Trace Conversion and Instrumentation
Learn about OTF Tools, API, trace conversion, TAU instrumentation, Vampir tools, and more. Explore OTF file hierarchy and processing tools like otfaux and otfmerge.

Comprehensive OTF Tutorial for Trace Conversion and Instrumentation
E N D
Presentation Transcript
Open Trace Format (OTF) Tutorial Wolfgang E. Nagel, Holger Brunst, T.U. Dresden, Germany Sameer Shende, Allen D. Malony, ParaTools, Inc. http://www.vampir.eu otf@paratools.com
Outline • An overview of OTF, TAU and Vampir/VNG • OTF • Tools • API • Building trace conversion tools • TAU • Instrumentation • Measurement • Analysis • Scalable Tracing • Vampir • VNG • OTF
Tutorial Goals • This tutorial is intended as an introduction to OTF tools. • Today you should leave here with a better understanding of… • OTF API and tools • Steps involved in building a trace conversion tool to target OTF • How to instrument your programs with TAU to generate OTF • Automatic instrumentation at the routine level and outer loop level • Manual instrumentation at the loop/statement level • Measurement options provided by TAU • Environment variables used for choosing metrics, generating performance data • How to use the Vampir and VNG tools • Nature and types of visualization that VNG provides for visualizing OTF traces
Server Trace 1 Trace 2 Trace 3 Worker 1 Trace N Master Worker 2 Worker m Vampir: Technical Components Tools • Trace generator • Classical Vampir viewer and analyzer • Vampir client viewer • Parallel server engine • Conversion and analysis tools
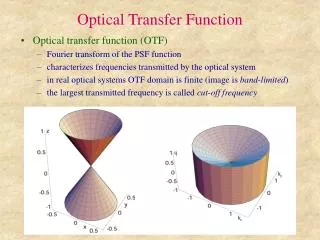
OTF Features • Fast and efficient sequential and parallel access • Platform independent • Selective access to • Processes • Time intervals • API / Interfaces • High level interface for analysis tools • Read/write complete traces with multiple files • Supports filtering and parallel I/O • Low level interface for trace libraries
Relative File Size Better
Read Performance Better
Performance Scalability Better
Parallel Program File System Analysis Server MergedTraces Worker 1 Master Classic Analysis: • monolithic • sequential Trace 1 Worker 2 Trace 2 Trace 3 Trace N Worker m Internet Visualization Client Vampir Server Workflow Monitor System (TAU/Kojak) Event Streams Message Passing ParallelI/O Process Timeline with 16 visible Traces Segment Indicator 768 Processes Thumbnail
Worker Master Message Passing Message Passing Worker 1 Master Session Thread Session Thread Worker 2 Analysis Module Analysis Merger Worker m Visualization Client Event Databases Endian Conversion Traces Trace Format Driver Socket Communication N Session Threads N Session Threads M Worker Organization of Parallel Analysis
Scalability – sPPM Analyzed on Origin 2000 • sPPM ASCI Benchmark • 3D Gas Dynamic • Data to be analyzed • 16 Processes • 200 MByte Volume
A Fairly Large Test Case • IRS ASCI Benchmark • Implicit Radiation Solver • Data to be analyzed: • 64 Processes in8 Streams • Approx.800.000.000 Events • 40 GByte Data Volume • Analysis Platform: • Jump.fz-juelich.de • 41 IBM p690 nodes (32 processors per node) • 128 GByte per node • Visualization Platform: • Remote Laptop
Outline • An overview of OTF, TAU and Vampir/VNG • OTF • Tools • API • Building trace conversion tools • TAU • Instrumentation • Measurement • Analysis • Scalable Tracing • Vampir • VNG • OTF
OTF Contents • Definition records • Map event ids to interval (begin/end) event names • Symbols for atomic events • Process groups • Performance events • Timestamped events for entering or leaving a state • Timestamped counter events (monotonically increasing or not) • Global master file • Mapping processes to streams • Statistical Summaries • Overview over a whole interval of time • Snapshots • Callstack, list of pending messages, etc. at a point in time
otfmerge • Allows an existing OTF trace to alter the number of streams • Add snapshots or statistics to the merged trace file • otfmerge - converter program of OTF library. otfmerge [Options] <input file name> options: -h, --help show this help message -n <n> set number of streams for output -f <n> set max number of filehandles available -o <name> namestub of the output file (default ’out’) -rb <size> set buffersize of the reader -wb <size> set buffersize of the writer -stats cover statistics too -snaps cover snapshots too -V show OTF version
OTF Tools: otfaux • otfaux • Adds auxillary snapshot and/or statistics information to the trace file • Snapshots include callstack, pending messages, current counter values • Statistics include number of calls, exclusive/inclusive time • Statistics are monotonically increasing - unlike profiles • Original event trace is unmodified • Auxillary data is generated at breakpoints -periodically or at ticks
otfaux • otfaux - append snapshots and statistics to existing otf traces at given ’break’ time stamps otfaux [Options] <file name> Options: -h, --help show this help message -b <size> buffer size for read and write operations -n <n> number of breaks (distributed regularly) if -p and -t are not set, the default for -n is 200 breaks -p <p> create break every ’p’ ticks (if both, -n and -p are specified the one producing more breaks wins) -t <t> define (additional) break at given time stamp -F force overwrite old snapshots and statistics -R delete existing snapshots and statistics only -f <n> max number of filehandles output ...
otfaux (contd.) -g create functiongroup summaries instead of function summaries -v verbose mode, print break time stamps -V show OTF version -a show advancing progress during operation -- snapshots write ONLY snapshots but NO statistics --statistics write ONLY statistics but NO snapshots -s a[,b]* regard given streams only when computing statistics. expects a single token or comma separated list. this implies the ’--statistics’ option! -l list existing stream tokens
tau2otf • Converts TAU traces to OTF • tau2otf <TAU trace> <edf file> <out file> [-n streams] [-nomessage] [-z] [-v] -n <streams> : Specifies the number of output streams (default 1) -nomessage : Suppress printing of message information in the trace -z : Enable compression of trace files. By default it is uncompressed. -v : Verbose Trace format of <out file> is OTF % tau2otf merged.trc tau.edf app.otf
vtf2otf • Convert VTF traces to OTF format • vtf2otf [Options] <input file name> Options: -o <file> output file -f <n> max count of filehandles -n <n> output stream count -b <n> size of the writer buffer -V show OTF version
otf2vtf • Convert OTF trace files to VTF format • otf2vtf [Options] <input file name> Options: -o <file> output file -b <n> size of the reader buffer -A write VTF3 ASCII sub-format (default) -B write VTF3 binary sub-format -V show OTF version
Building Trace Analysis Tools • Writing OTF traces in trace conversion tools • High level API writes multiple streams • Low level API writes a single stream • Each OTF file has a prefix (e.g., app.otf) • Parallel reading and searching in OTF analysis tools • Each process in tool reads local and global event definitions • Each process reads a subset of events • Read summary information to select interesting spots in trace • Tool might read a selected time interval for analysis • OTF supports efficient binary search • Tool may support for compressed or uncompressed OTF trace • Tool may support for single or multi-stream OTF traces
OTF Trace Writer API - OTF_FileManager_open • Generates a new file manager with a maximum number of files that are allowed to be open simultaneously • OTF_FileManager* OTF_FileManager_open( uint32_t number ); #include <otf.h> OTF_FileManager *manager; manager = OTF_FileManager_open(256);
OTF_FileManager_close • Closes the file manager • void OTF_FileManager_close( OTF_FileManager* m ); #include <otf.h> OTF_FileManager_close(manager);
OTF_Writer_open • Define file control block for output trace file • OTF_Writer* OTF_Writer_open( char* fileNamePrefix, uint32_t numberOfStreams, OTF_FileManager* fileManager ); #include <otf.h> void *fcb = (void *) OTF_Writer_open(out_file, num_streams, manager);
OTF_Writer_setCompression • Enable compression if specified by the user • int OTF_Writer_setCompression( OTF_Writer* writer, OTF_FileCompression); #include <otf.h> OTF_Writer_setCompression((OTF_Writer *)fcb, OTF_FILECOMPRESSION_COMPRESSED);
OTF_Writer_writeDefCreator • Specify a comment about the creator (trace conversion tool) • int OTF_Writer_writeDefCreator( void* userData, uint32_t stream, /* stream = 0 means global definition */ const char* creator ); #include <otf.h> OTF_Writer_writeDefCreator(fcb, 0, “MyTool2otf ver 2.42”);
OTF_Writer_writeDefProcess • Write a process definition record • int OTF_Writer_writeDefProcess( OTF_Writer* writer, uint32_t stream, uint32_t process, const char* name, uint32_t parent ); #include <otf.h> OTF_Writer_writeDefProcess( (OTF_Writer *)fcb, 0, cpuid, name, 0);
OTF_Writer_writeDefTimerResolution • Provides the timer resolution. All timestamps are interpreted based on this resolution. By default it is 1 microseconds. • int OTF_Writer_write_DefTimerResolution( void* userData, uint32_t stream, uint64_t ticksPerSecond ); #include <otf.h> OTF_Writer_writeDefTimerResolution((OTF_Writer*) userData, 0, getTicksPerSecond());
OTF_Writer_write_DefFunction • Provide a function definition and specify an event id to name mapping • int OTF_Writer_write_DefFunction( void* userData, uint32_t stream, uint32_t func, const char* name, uint32_t funcGroup, uint32_t source ); /* specify source code location */ #include <otf.h> OTF_Writer_writeDefFunction((OTF_Writer*)userData, 0, eventID, (const char *) name, groupID, 0);
OTF_Writer_writeDefFunctionGroup • Provides a function group definition • int OTF_Handler_DefFunctionGroup( void* userData, uint32_t stream, uint32_t funcGroup, const char* name ); #include <otf.h>OTF_Writer_writeDefFunctionGroup((OTF_Writer*)userData, 0, groupId, GroupName);
OTF_Writer_writeEnter • Write a function entry record • int OTF_Writer_writeEnter( OTF_Writer* writer, uint64_t time, uint32_t function, uint32_t process, uint32_t source ); #include <otf.h> OTF_Writer_writeEnter((OTF_Writer*)userData, GetClockTicksInGHz(time), stateid, cpuid, 0);
int OTF_Writer_writeSendMsg • Write a send message record • int OTF_Writer_writeSendMsg( OTF_Writer* writer, uint64_t time, uint32_t sender, uint32_t receiver, uint32_t procGroup, uint32_t tag, uint32_t length, uint32_t source );
int OTF_Writer_writeRecvMsg • Write a receive message record • int OTF_Writer_writeRecvMsg( OTF_Writer* writer, uint64_t time, uint32_t receiver, uint32_t sender, uint32_t procGroup, uint32_t tag, uint32_t length, uint32_t source );
OTF Trace Reader API • Similar to trace writer API • Instead of Write, create a Handler for callbacks, e.g., • int OTF_Handler_DefFunction( void* userData, uint32_t stream, uint32_t func, const char* name, uint32_t funcGroup, uint32_t source );
OTF Trace Reader API • Similar to trace writer API • Instead of Write, create a Handler for callbacks • Specify the parameters to the handler routine • After setting up handlers, read events, snapshots, definitions.... The library invokes appropriate handlers • Close the file manager and exit cleanly
Global Read Operations • Open array handler • Open OTF reader • Control the buffer size • Set handler and arguments • Read definitions • Read snapshots • Read events • Close reader
OTF_HandlerArray_open/close • To open a new array of handlers and then fill in the callback routines • OTF_HandlerArray *OTF_HandlerArray_open( void); #include <otf.h> OTF_HandlerArray *handlers; handlers = OTF_HandlerArray_open(); • To close the array, use OTF_HandlerArray_close OTF_HandlerArray_close(handlers);
A Sample Handler • int OTF_handleDefinitionComment( void* fcb, uint32_t streamid, const char* comment ) { /* written by user; called by OTF */ } • The first argument is a file control block. We need to pass this argument and the callback function’s address to the OTF reader.
OTF_HandlerArray_setHandler • int OTFHandlerArray_setHandler( OTF_HandlerArray *handlers, OTFFunctionPointer *pointer, uint32_t recordtype); • int OTF_HandlerArray_setFirstHandlerArg( OTF_HandlerArray* handlers, void* firsthandlerarg, uint32_t recordtype ); • To specify any user defined pointer that should be passed as the first argument. Useful for keeping track of location.
OTF_HandlerArray_setHandler #include <otf.h> OTF_HandlerArray *handlers = OTF_HandlerArray_Open(); ... /* put the callback routine’s address in the array */ OTF_HandlerArray_setHandler( handlers, (OTF_FunctionPointer*) OTF_handleDefinitionComment, OTF_DEFINITIONCOMMENT_RECORD ); /* specify the file position/any address (of say the trace writer) as the first argument*/ OTF_HandlerArray_setFirstHandlerArg( handlers, &fcb, OTF_DEFINITIONCOMMENT_RECORD ); /* invokes OTF_handleDefinitionComment routine*/
OTF_Reader_open • Opens a master control file and returns an OTF_Reader • OTF_Reader * OTF_Reader_open(char *name, OTF_FileManager *manager); #include <otf.h> OTF_FileManager *manager = OTF_FileManager_open(256); OTF_Reader *reader = OTF_Reader_open(“inputfile”, manager);
User defined handlers for definitions • int handleDeftimerresolution( void* firsthandlerarg, uint32_t streamid, uint64_t ticksPerSecond ) { ...} • int handleDefprocess( void* firsthandlerarg, uint32_t streamid, uint32_t deftoken, const char* name, uint32_t parent) { ... } • int handleDefprocessgroup( void* firsthandlerarg, uint32_t streamid, uint32_t deftoken, const char* name, uint32_t n, uint32_t* array ) { } • int handleDeffunction( void* firsthandlerarg, uint32_t streamid, uint32_t deftoken, const char* name, uint32_t group, uint32_t scltoken ) { } • int handleDefcounter( void* firsthandlerarg, uint32_t streamid, uint32_t deftoken, const char* name, uint32_t properties, uint32_t countergroup, const char* unit ) { } ...
User defined handlers for timestamped events • int handleCounter( void* firsthandlerarg, uint64_t time, uint32_t process, uint32_t token, uint64_t value ) {... } • int handleRecvmsg( void* firsthandlerarg, uint64_t time, uint32_t receiver, uint32_t sender, uint32_t communicator, uint32_t msgtype, uint32_t msglength, uint32_t scltoken ) • int handleSendmsg( void* firsthandlerarg, uint64_t time, uint32_t sender, uint32_t receiver, uint32_t communicator, uint32_t msgtype, uint32_t msglength, uint32_t scltoken ) • int handleEnter( void* firsthandlerarg, uint64_t time, uint32_t statetoken, uint32_t cpuid, uint32_t scltoken ) {...} • int handleLeave( void* firsthandlerarg, uint64_t time, uint32_t statetoken, uint32_t cpuid, uint32_t scltoken ) {...}
OTF_Reader_readDefinitions • int OTF_Reader_readDefinitions(OTF_Reader *r, OTF_HandlerArray *handlers); #include <otf.h> OTF_HandlerArray *handlers = OTF_HandlerArray_open(); OTF_Manager *manager = OTF_FileManager_open(100); OTF_Reader *reader = OTF_Reader_open(inputFile, manager); /* set up handlers */ OTF_Reader_readDefinitions(reader, handlers); /* OTF invokes handlers for process, functions, groups and counters here */
OTF_Reader_readEvents • int OTF_Reader_readEvents(OTF_Reader *reader, OTF_HandlerArray *handlers); #include <otf.h> OTF_Reader_readEvents (reader, handlers); /* invokes handlers for timestamped message communication, routine entry/exit, counter events */