Download
1 / 25
250 likes | 300 Views
Explore how a Machine Learning model can forecast blood glucose levels to aid in diabetes management, preventing complications and improving patient safety.

E N D
A Machine Learning Approach to Predicting Blood Glucose Levels for Diabetes Management • Kevin Plis • RazvanBunescu • Cindy Marling • Jay Shubrook • Frank Schwartz School of EECS Russ College of Engineering and Technology Ohio University, Athens, Ohio • The Diabetes Institute • Heritage College of Osteopathic Medicine • Ohio University, Athens, Ohio
Introduction to Diabetes • In Type 1 Diabetes the pancreas fails to produce insulin, a hormone needed to convert food into energy and regulate Blood Glucose Levels (BGL). • Type 1 Diabetes cannot be prevented or cured, but it can be managed with outside insulin sources, and BG control. • Patients must monitor their BGL throughout the day and adjust insulin doses to keep their BGL as close to normal as possible (Between 70 and 140 mg/dl).
Insulin Pump Therapy Systems • CGM Sensor: • interstitial BGL. • every 5 minutes. • Insulin Pumpdelivers insulin through boluses and basal rate: • Basal Rate: Continuous insulin pumped throughout the day. • Boluses: Extra insulin taken with meals to keep BGL from spiking.
Blood Glucose Control Delays and Avoids Complications • Foot Ulcers • Angina • Heart Attack • Coronary Bypass Surgery • Stroke • Kidney Transplant • Dialysis • Blindness • Amputation • Albuminuria • Macular Edema • Proliferative • Retinopathy • Periodontal Disease • Impotence • Gastroparesis • Depression RISK • Microalbuminuria • Mild Retinopathy • Mild Neuropathy CONTROL Good Poor
Achieving Blood Glucose Control • Patients must monitor their BGL throughout the day and adjust insulin doses to keep their BGL as close to normal as possible (Between 70 and 140 mg/dl). • Try to avoid: • Hypoglycemia • Hyperglycemia • Excessive Glycemic Variability Prediction of Blood Glucose Levels Measurement of Glycemic Variability
Blood Glucose Level Prediction: • Hypoglycemia prediction is one safety critical application. • Glycemic Variability Measurement: • Enables detection of excessive glycemic variability. • Decision Support for Diabetes Management: • Detecting blood glucose control problems and recommending therapeutic adjustments facilitates better control. • Patient data comes from insulin pumps and CGM sensors as well as from patient-entered life events. • Database contains over 1,600 days worth of clinical patient data.
Blood Glucose Prediction • A Support Vector Regression (SVR) model is used to predict future blood glucose levels on real patient data: • Given a patient and a time t0 the SVR predicts the BGL for any 5 minute increment up to t0 + 60. • SVR trained using the data from the week before t0for each test point. • Parameters tuned using a grid search and the patient data available preceding the training data.
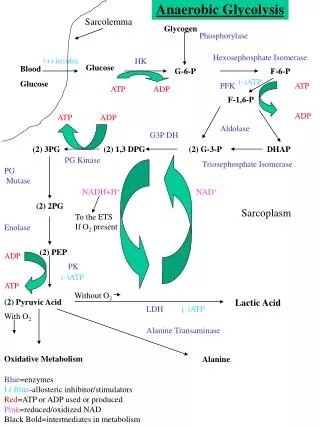
Features Used • 12 Delta features that compute the BGL changes over the last hour. • Deltai = BG(t0) – BG(t0 – 5i) for 1 ≤ i ≤ 12 • Train a standard Auto Regressive Integrated Moving Average (ARIMA) Model and use the 12 predictions in the hour after t0 as features. • Trained on only CGM data. • Predicted state variables from the physiological model • carbs: consumed and digested. • insulin: subcutaneous, mass, and active plasma. • blood glucose: mass and concentration.
Physiological Model Basal rate, insulin bolus, and recent meal data all factor into the physiological model. Insulin, Meal Insulin, Meal Time step t Time step t + 1 carbohydrate consumption carbohydrate digestion subcutaneous insulin insulin mass active plasma insulin level blood glucose mass blood glucose concentration carbohydrate consumption carbohydrate digestion subcutaneous insulin insulin mass active plasma insulin level blood glucose mass blood glucose concentration State Transition Function ...
Blood Glucose Prediction Dataset • 5 patients with Type 1 Diabetes wore Continuous Glucose Monitors for 90 days, and recorded life events through a website interface. • 40 points selected from each patient, resulting in 200 test points. • Points selected manually to reflect a diverse set of situations as well as to contain difficult situations to predict. • SVR compared to ARIMA, t0, and three physicians Root Mean Square Error of predictions
Hypoglycemia Prediction Test • Avoiding hypoglycemic events is critical to patient safety. • Short term complications include dizziness, loss of consciousness, coma and death. • Can the SVR predict that a hypoglycemic event will occur within the next hour, half an hour in advance? Hypoglycemia
Hypoglycemia Prediction Test Output from patient’s CGM provides their current BGL Patient goes hypo at t0 + 30 CGM reading below 70 mg/dl is considered hypoglycemic Simulated Data for Illustrative Purposes
Hypoglycemia Prediction Test SVR provides predicted BGL using information available before t0 Predicted BGL > 70 mg/dl at t0 + 30 and t0 + 60 SVR predicts the patient goes hypo at t0 + 35 Simulated Data for Illustrative Purposes
Hypoglycemia Prediction Test Predicted BGL > 70 mg/dl at t0 + 30 and t0 + 60 SVR predicts patient goes hypo at t0 + 10 Simulated Data for Illustrative Purposes
Hypoglycemia Prediction Dataset • The original dataset of 200 points only contained 13 hypo events • All 90 days of data for the same 5 patients contained 152 hypo events. • Short or error-prone hypo events were discarded. • True distribution used: • Using this ratio yielded 5,816 test points Hypo Event Non-Hypo Event
Hypoglycemia Prediction Results • The SVR had 47 False Positives and 35 True Positives • All 47 FPs had actual BGLs below 140 mg/dl • 32 FPs had actual BGLs below 80 mg/dl • RMSE results show that SVR outperforms ARIMA and t0 FPR = FP/(FP+TN) aka: Fall-out Recall = TP/(TP+FN) aka: Sensitivity, TPR Precision = TP/(TP+FP) aka: Positive Predictive Value PPV F-Measure = 2 x (Precision x Recall) / (Precision + Recall) aka: F-Score, F1, Harmonic Mean
Changes Since Paper Submission • The physiological model’s prediction horizon was changed X Physiologic Model Phys(t0+30) Phys(t0+60) Past BGL+ Events SVR BGL(t0+X) Phys(t0+X) Phys(t0+60) • Consider the threshold for predicting hypoglycemia τ • If BGLPred < τ, Predicted hypo • If BGLPred ≥ τ, Predicted non-hypo • What if we changed the value of τ? • This does not change whether the actual point is hypo or not, just whether or not it is predicted to be hypo.
New Hypoglycemia Results The TPR raises significantly The TPR raises significantly But with a large drop in precision With only a small drop in precision FPR = FP/(FP+TN) aka: Fall-out Recall = TP/(TP+FN) aka: Sensitivity, TPR Precision = TP/(TP+FP) aka: Positive Predictive Value PPV F-Measure = 2 x (Precision x Recall) / (Precision + Recall) aka: F-Score, F1, Harmonic Mean
New Hypoglycemia Results • Using 70 mg/dl as a threshold resulted in 47 FPs and 42 TPs • 31 of the FPs had actual BGLs below 80 mg/dl • Only 3 of the FPs had actual BGLs above 100 mg/dl • Using 75 mg/dl as a threshold resulted in 88 FPs and 69 TPs • 68 of the FPs had actual BGLs below 80 mg/dl • Only 4 of the FPs had actual BGLs above 100 mg/dl • For all 3 thresholds, all of the False Positives had actual BGLs below 140 mg/dl
Future Work • Other life events known to affect BGL can be used in the SVR model as features. • Some life events, such as sleep, stress, or illness, are already captured by our data collection. • We are looking to incorporate physiological sensors into our data collection. • This reduces the burden on the patient to enter data. • Reduces the amount of missing data and errors in the data • Can be used to infer life events such as exercise and sleep • Physiological sensors may be able to detect signs of changing BGLs, such as sweating when the BGL is too low.
Conclusions • The SVR model is able to outperform both physicians and ARIMA at predicting future BGL. • Our current SVR model has a true positive rate of 43.95%, a precision of 43.95%, and 77% of the false positives occurring in the near-hypoglycemic region. • While these results are a proof of concept, there is still room for improvement.
Acknowledgements • This material is based upon work supported by the National Science Foundation under Grant Number 1117489. • We would like to thank: • Our current and former graduate and undergraduate research assistants: • MelihAltun, Michael Cleaver, Kiley Harkins, Charlie Murphy, NattadaNimsuwan, Hannah Quillin, Nigel Struble, and Matt Wiley. • Our dedicated research nurses: • Lynn Petrik and CammieStarner. • Over 50 anonymous patients with type 1 diabetes on insulin pump therapy. • Our generous sponsors:
References • Andreassen, S.; Benn, J. J.; Hovorka, R.; Olesen, K. G.; and Carson, E. R. 1994. A probabilistic approach to glucose prediction and insulin dose adjustment: Description of metabolic model and pilot evaluation study. Computer Methods and Programs in Biomedicine 41:153–165. • Box, G. E. P.; Jenkins, G. M.; and Reinsel, G. C. 2008. Time Series Analysis: Forecasting and Control, 4th Edition. Wiley. • Briegel, T., and Tresp, V. 2002. A nonlinear state space model for the blood glucose metabolism of a diabetic. Automatisierungstechnik50:228–236. • Bunescu, R.; Struble, N.; Marling, C.; Shubrook, J.; and Schwartz, F. 2013. Blood glucose level prediction using physiological models and support vector regression. In Proceedings of the IEEE 12th International Conference on Machine Learning and Applications (ICMLA). Miami, FL: IEEE. • Dassau, E.; Lowe, C.; Barr, C.; Atlas, E.; and Phillip, M. 2012. Closing the loop. International Journal of Clinical Practice 66:20–29. • Diabetes Control and Complications Trial Research Group. 1993. The effect of intensive treatment of diabetes on the development and progression of long-term complications in insulin-dependent diabetes mellitus. New England Journal of Medicine 329(14):977–986. • Duke, D. L. 2009. Intelligent Diabetes Assistant: A Telemedicine System for Modeling and Managing Blood Glucose. Ph.D. Dissertation, Carnegie Mellon University, Pittsburgh, Pennsylvania. • Jensen, M. H.; Christensen, T. F.; Tarnow, L.; Seto, E.; Johansen, M. D.; and Hejlesen, O. K. 2013. Real-time hypoglycemia detection from continuous glucose monitoring data of subjects with type 1 diabetes. Diabetes Technology and Therapeutics 15(7). • Juvenile Diabetes Research Foundation. 2014. Artificial pancreas project research. http://jdrf.org/research/treat/artificial-pancreas-project/, accessed April, 2014. • Klonoff, D. C. 2007. The artificial pancreas: How sweet engineering will solve bitter problems. Journal of Diabetes Science and Technology 1(1):72–81. • Lehmann, E., and Deutsch, T. 1998. Compartmental models for glycaemicprediciton and decision-support in clinical diabetes care: promise and reality. Computer Methods and Programs in Biomedicine 56:133–204. • Marling, C.; Wiley, M.; Bunescu, R. C.; Shubrook, J.; and Schwartz, F. 2012. Emerging applications for intelligent diabetesmanagement. AI Magazine 33(2):67–78. • Simon, D. 2006. Optimal State Estimation: Kalman, H Infinity, and Nonlinear Approaches. Wiley. • Smola, A. J., and Scholkopf, B. 1998. A tutorial on support vector regression. Technical report, NeuroCOLT2 Technical Report Series. • Time Magazine. 2013. The 25 best inventions of the year 2013. http://techland.time.com/2013/11/14/the-25-bestinventions-of-the-year-2013/slide/the-artificial-pancreas/, accessed April, 2014. • Wang, Q.; Molenaar, P.; Harsh, S.; Freeman, K.; Xie, J.; Gold, C.; Rovine, M.; and Ulbrecht, J. 2014. Personalized state-space modeling of glucose dynamics for type 1 diabetes using continuously monitored glucose, insulin dose, and meal intake: An extended kalman filter approach. Journal of Diabetes Science and Technology 8(2):331–345. • Zecchin, C.; Facchinetti, A.; Sparacino, G.; and Cobelli, C. 2013. Reduction of number and duration of hypoglycemic events by glucose prediction methods: A proof-of-concept in silicostudy. Diabetes Technology & Therapeutics 15(1):66–77.