Download
1 / 50
500 likes | 535 Views
Learn how to understand and plot BMI on growth charts for better healthcare screening. Discover the importance of BMI for children's health and how to assess risks using BMI-for-age percentiles.

E N D
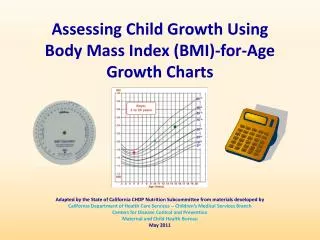
Using the Body Mass Index (BMI)-for-age Growth Charts: A Training for Health Care Provider Assistants Adapted by the CHDP Bay Area Nutrition Subcommittee (BANS) from Centers for Disease Control and Prevention National Center for Chronic Disease Prevention and Health Promotion Division of Nutrition and Physical Activity Maternal and Child Nutrition Branch January 2006
Training Objectives • Understand BMI and its importance for health care providers • Learn how to plot BMI on the BMI-for-age growth charts
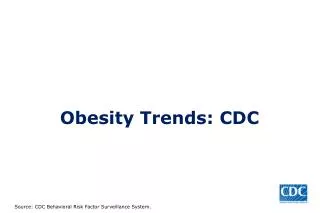
No Data <10% 10%–14% Obesity Trends* Among U.S. AdultsBRFSS, 1985 (*BMI ≥30, or ~ 30 lbs overweight for 5’ 4” person)
No Data <10% 10%–14% Obesity Trends* Among U.S. AdultsBRFSS, 1986 (*BMI ≥30, or ~ 30 lbs overweight for 5’ 4” person)
No Data <10% 10%–14% Obesity Trends* Among U.S. AdultsBRFSS, 1987 (*BMI ≥30, or ~ 30 lbs overweight for 5’ 4” person)
No Data <10% 10%–14% Obesity Trends* Among U.S. AdultsBRFSS, 1988 (*BMI ≥30, or ~ 30 lbs overweight for 5’ 4” person)
No Data <10% 10%–14% Obesity Trends* Among U.S. AdultsBRFSS, 1989 (*BMI ≥30, or ~ 30 lbs overweight for 5’ 4” person)
No Data <10% 10%–14% Obesity Trends* Among U.S. AdultsBRFSS, 1990 (*BMI ≥30, or ~ 30 lbs overweight for 5’ 4” person)
No Data <10% 10%–14% 15%–19% Obesity Trends* Among U.S. AdultsBRFSS, 1991 (*BMI ≥30, or ~ 30 lbs overweight for 5’ 4” person)
No Data <10% 10%–14% 15%–19% Obesity Trends* Among U.S. AdultsBRFSS, 1992 (*BMI ≥30, or ~ 30 lbs overweight for 5’ 4” person)
No Data <10% 10%–14% 15%–19% Obesity Trends* Among U.S. AdultsBRFSS, 1993 (*BMI ≥30, or ~ 30 lbs overweight for 5’ 4” person)
No Data <10% 10%–14% 15%–19% Obesity Trends* Among U.S. AdultsBRFSS, 1994 (*BMI ≥30, or ~ 30 lbs overweight for 5’ 4” person)
No Data <10% 10%–14% 15%–19% Obesity Trends* Among U.S. AdultsBRFSS, 1995 (*BMI ≥30, or ~ 30 lbs overweight for 5’ 4” person)
No Data <10% 10%–14% 15%–19% Obesity Trends* Among U.S. AdultsBRFSS, 1996 (*BMI ≥30, or ~ 30 lbs overweight for 5’ 4” person)
No Data <10% 10%–14% 15%–19% ≥20 Obesity Trends* Among U.S. AdultsBRFSS, 1997 (*BMI ≥30, or ~ 30 lbs overweight for 5’ 4” person)
No Data <10% 10%–14% 15%–19% ≥20 Obesity Trends* Among U.S. AdultsBRFSS, 1998 (*BMI ≥30, or ~ 30 lbs overweight for 5’ 4” person)
No Data <10% 10%–14% 15%–19% ≥20 Obesity Trends* Among U.S. AdultsBRFSS, 1999 (*BMI ≥30, or ~ 30 lbs overweight for 5’ 4” person)
No Data <10% 10%–14% 15%–19% ≥20 Obesity Trends* Among U.S. AdultsBRFSS, 2000 (*BMI ≥30, or ~ 30 lbs overweight for 5’ 4” person)
Obesity Trends* Among U.S. AdultsBRFSS, 2001 (*BMI ≥30, or ~ 30 lbs overweight for 5’ 4” person) No Data <10% 10%–14% 15%–19% 20%–24% ≥25%
Obesity Trends* Among U.S. AdultsBRFSS, 2002 (*BMI ≥30, or ~ 30 lbs overweight for 5’ 4” person) (*BMI 30, or ~ 30 lbs overweight for 5’4” person) No Data <10% 10%–14% 15%–19% 20%–24% ≥25%
Obesity* Trends Among U.S. AdultsBRFSS, 2003 (*BMI ≥30, or ~ 30 lbs overweight for 5’ 4” person) No Data <10% 10%–14% 15%–19% 20%–24% ≥25%
How many…? Nine Million Kids are Overweight 2000 2005
Pediatric Nutrition Surveillance System (PedNSS) Growth Statistics forCity and County of San Francisco 2004BMI for age > 95% for Children 2-4 Years All Races 17.90% not enough data
Pediatric Nutrition Surveillance System (PedNSS) Growth Statistics forCity and County of San Francisco 2004BMI for age > 95% for Children 5-19 Years All Races 19.20% White 17.90%
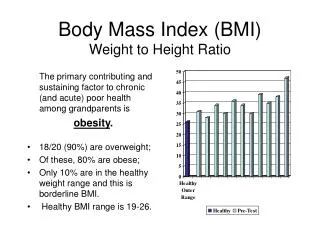
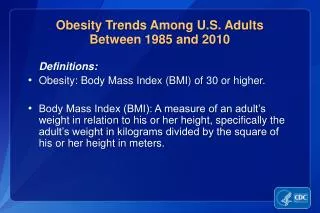
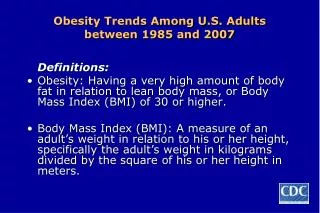
What is BMI? • A number that compares a child’s weight to her height • Body Mass Index (BMI) = Weight (kg) / Height (m)² • BMI is an effective SCREENING test to check for possible overweight; but alone it is nota diagnostic tool
BMI is Not the Same for Adults and Children • Adult BMI is evaluated by use of cut-off numbers; for example BMI >30 is indicative of adult obesity • The BMI for children is useful only when it is plotted on the “BMI-for-age Growth Chart”
For Children, BMI Changes with Age BMI BMI Example: 95th percentile tracking Age BMI 2 yrs 19.3 4 yrs 17.8 9 yrs 21.0 13 yrs 25.1 Boys: 2 to 20 years BMI BMI
Importance of Using BMI-for-age • Associated with clinical risk factors for chronic disease including hyperlipidemia, elevated insulin, and high blood pressure
CDC Standardized Growth Chart Formula to calculate BMI Percentiles (5th,10th,25th, 50th, 75th,85th,90th,95th) Published May 30, 2000
What is a Percentile? 50th Percentile 85th 5th 95th
Using BMI-for-age Percentiles to Assess Risk > 95th percentile Overweight 85th to < 95thRisk of percentile overweight < 5th percentile Underweight
Steps to Plot BMI-for-age • Obtain accurate weight and height measurements • Select the appropriate growth chart • Record the data • Calculate BMI • Plot measurements
BMI BMI Boys: 2 to 20 years BMI BMI • Obtain Accurate Weight and Height Measurements • Accurate Measurements are Critical 5 year old boy Weight: 43.5 lb Height: 43 in BMI= 16.5 BMI-for-age = 75-84th %tile Inaccurate height measurement: 42.5 in BMI=17 BMI-for-age = 85-94th %tile
2. Select the Appropriate Growth Chart • For ages birth to 36 months old: • “Length-for-age,” and “Weight-for-age” • “Weight-for-length,” and “Head Circumference-for-age” • For ages 2 to 20 years: • “Weight-for-age,” and “Stature-for-age” • Body Mass Index “BMI-for-age”
4. Calculate BMI English: Wt (lbs.) ÷Ht (in.) ÷ Ht (in.) x 703 Metric: Wt (kg.) ÷Ht (cm.) ÷ Ht (cm.) x 10,000
4. Calculate BMI • Use a Pediatric BMI Wheel
5. Plot Measurements 95th 85th 75th 50th BMI 5th Age
Practice using “BMI-for-age” Growth Chart Pete (3 y) Gabriella (4 y) Liz (4 y) Photos from UC Berkeley Longitudinal Study, 1973
Please Plot Pete Perfectly Measurements for Pete: Age= 3 y 3 wks Weight= 41 lbs (18.6 kg) Height= 39.7 in (100.8 cm) Find BMI and plot. BMI= Wt ( lbs) ÷ Ht (in) ÷ Ht (in) x 703 Photo from UC Berkeley Longitudinal Study, 1973
BMI BMI Boys: 2 to 20 years BMI BMI Answers: Pete’s “BMI-for-age” BMI=18.3
Liz’s - BMI 17.7 Liz
Please visit: www.cdc.gov/growthcharts/ • For additional training materials related to the growth charts • For tools related to the growth charts • To download the growth charts
References • Guidelines for Overweight in Adolescent Preventive Services (Am J Clin Nutr 1994;59:307-316) • Obesity Evaluation and Treatment: Expert Committee Recommendations (Pediatrics 1998 Sept;(102)3:e 29) • Assessment of Childhood and Adolescent Obesity: International Obesity Task Force (Am J Clin Nutr 1999, 70,suppl) • Centers for Disease Control and Prevention Website (www.cdc.gov/growthcharts) • American Academy of Pediatrics Policy Statement: Prevention of Pediatric Overweight and Obesity (Pediatrics 2003 Aug (112)2; 424-430)