Download
1 / 1
10 likes | 161 Views
Examining Publicly-Accessible Tall-Tower Wind Observations In Real-Time Alexander A. Jacques and John D. Horel University of Utah. PROJECT MOTIVES. Storing and Visualizing Tall-Tower Observations. WIND RAMP EVENT EXAMPLES.

E N D
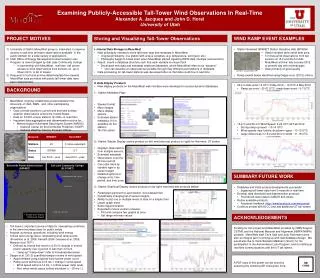
Examining Publicly-Accessible Tall-Tower Wind Observations In Real-Time Alexander A. Jacques and John D. Horel University of Utah PROJECT MOTIVES Storing and Visualizing Tall-Tower Observations WIND RAMP EVENT EXAMPLES • University of Utah’s MesoWest group is interested to improve access to real-time tall-tower observations available in the public domain for a wide variety of applications • Utah Office of Energy Development’s Anemometer Loan Program is now managed by Salt Lake Community College • In partnership with MesoWest, real-time cell phone access to wind observations from sensors on up to fifteen 20 m to 60 m towers • Requests to host and archive data/metadata from several MesoWest data providers with public tall-tower data have been implemented • I. Internal Data Storage in MesoWest • New philosophy needed to store tall-tower data and metadata in MesoWest • Original philosophy: one station with unique variables (e.g. temperature, wind gust, etc.) • Philosophy began to break down when MesoWest started ingesting RWIS data (multiple road sensors) • Result: create a database structure such that each variable is unique itself • Developed new data and metadata relational databases, which MesoWest refers to as “dynamic” • One can describe an observational variable through may different permutations of metadata • Data processing for tall-tower stations was developed after so that data could flow in real-time • Station Selected: BPANET Station Goodnoe Hills (BPGDH) • Station located within wind farm area • 5-minute wind observations from two sensors at 15.2 and 59.4 m AGL • MesoWest archive: late January 2012 to present day with minimal gaps • Data primarily of good quality • Ramp events below identified using Deppe et al. (2012) criteria Courtesy: Google Maps API • II. Data Display Products • New display products on the MesoWest web interface were developed to access dynamic databases • 1) Station Metadata Page • Station Tabular Display (active product on left, new beta-test product on right) for Herriman, UT station • 3) Station Graphical Display (active product on top-right, new beta-test products below) • 59.4 m AGL wind: 14 UTC 3 May 2012 – 14 UTC 4 May 2012 • Ramp-up event ~22-01 UTC; ramp-down event ~5-7 UTC • 15.2 m and 59.4 m Wind Speed: 0-24 UTC 22 Feb 2012 • Strong ramp-up event ~10-14 UTC • Wind speeds near turbine shutdown region ~13-15 UTC • Large differences in 15.2 and 59.4 m winds ~11-16 UTC BACKGROUND • Sleeker format • More images • Menu display options • Extended sensor metadata (if it is available for the station) • Text file option • MesoWest: ongoing collaborative project between the University of Utah, NWS, and other participating organizations • Goal: provide access to current and archived surface weather observations across the United States • Data for 34,000 unique stations (21,800+ in real-time) • Important data aggregation and dissemination source for… • Meteorological Automated Data Ingest System (MADIS) • National Center for Environmental Prediction (NCEP) • National Weather Service Forecast Offices • Displays observations from multiple sensors • Extended metadata • Observation count for 24-hour period • Can order table by variable type or by sensor height • Retained options to change units, time period, and time-zone Bonneville Power Administration (BPANET) Salt Lake Community College (SLCCNET) SUMMARY/FUTURE WORK Blacksmith’s Fork Canyon • Database and initial product developments successful • Ingesting tall-tower data from 3 networks in real-time • Develop data download and dissemination products • Provide tall-tower data to MADIS and others • Refine available products • Facebook feedback (http://www.facebook.com/mesowest) • Continue project with SLCC and add additional UT tall-towers Herriman • Parameters pertinent to each station (not a default list) • Dynamically changing list of sensor heights • Ability to plot one or multiple levels of data on a single chart • Larger graph sizes • Better legend location • Expected in future version releases: • Plot and compare two graphs at once • Set range min/max values Anderson Junction Single-level Towers Multi-level Towers ACKNOWLEDGEMENTS • Tall-towers: important source of data for nowcasting conditions in the lower boundary layer for public safety • Impacts numerous operations, including wind energy • Critical wind energy issue: nowcasting wind ramp events (Freedman et al. 2008; Kamath 2009; Greaves et al. 2009; Marquis et al. 2011) • Defined as events that result in a 50+% change in turbine power capacity over a period of less than 4 hours • “ramp-up”/“ramp-down” refer to increases/decreases. • Deppe et al. (2012) quantified ramps in terms of wind speed • Approximated using a typical wind turbine power curve • Ramp event defined as a ±3 ms-1 change in wind speed • Wind speed within 6-12 ms-1 (critical power ramp area) • Also when winds cause turbine shutdown (> ~25 ms-1). Funding for this project and MesoWest provided by NWS Support, CSTAR, and the National Mesonet and Alignment (NMPX/NMPA) projects. MesoWest staff Chris Galli and Judy Pechmann were also an integral part in coming up with new database design. We would also like to thank Brandon Malmann (SLCC) for his participation in the Anemometer Loan Program, and for setting up real-time communications with the UT tall towers. A PDF copy of this poster can be found by scanning the following QR code given here: QR CODE