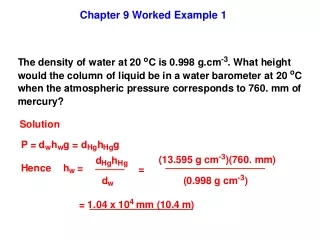
Worked Example: Highway Safety Modeling
310 likes | 326 Views
This project aims to estimate the safety benefits and collision cost savings associated with a proposed improved road alignment compared to the existing highway. The safety modeling process involves segmenting the project, assembling data, applying base collision prediction models, selecting design features, calculating crash modification factors (CMFs), and estimating safety performance.

Worked Example: Highway Safety Modeling
E N D
Presentation Transcript
Outline • Safety Modeling • Safety Modeling Process • Set-up for Worked Example • Develop / Build Safety Model • Project Segmentation • Selecting and Applying CPMs • Selecting and Applying CMFs • Estimating Safety Performance • Collision Costs / Economic Analysis • Summary
Safety Modeling • Involves two components • Application of “base” CPMs • CPM is used to estimate the expected normal safety performance for the facility • Application of CMFs • CMF is combined with the with the CPM to estimate the safety associated with the specific design features of the facility • Methodology follows FHWA - IHDSM and will be the recommended approach in the HSM • Somewhat analogous to ‘traffic modeling’
Safety Modeling Process • Systematic process for ‘Safety Modeling’ • Step 1: Understand Project/Limits and Segmentation • Step 2: Assemble requisite data (volume, design,…) • Step 3: Apply “Base” collision prediction model • Step 4: Select design features to include in Safety Model • Step 5: Calculate the CMFs for selected design features • Step 6: Estimate safety performance • Step 7: Calculate collision costs
Set-Up for Worked Example • Consider 2 alignments: • 1) Existing Alignment (Base Case) • Characterized by poor horizontal alignment and reduced cross-sectional dimensions • 2) Proposed Improved Alignment (Option 1) • Characterized by improved horizontal alignment and increased cross-sectional design • Objective: • To estimate the safety benefits associated with the proposed new alignment and the corresponding collision cost savings • Business Case, MAE, Project Justification…
End End T9 T3 C8 T7 C2 C6 T5 T3 C4 T1 C2 T1 Start Start • Existing Road “Base Case” • Improved Road “Option 1”
Set-Up for Worked Example • Existing Highway • RAU2 Highway • Existing traffic volume • 7500 AADT • Poor geometry • 5 Tangents / 4 Curves • Sub-standard curves • Steep grades • Cross-section • 3.0 meter lanes • 1.5 meter shoulders • Hazardous roadside • Improvement Option 1 • RAU2 Highway • Existing traffic volume • 7500 AADT • Favorable geometry • 2 Tangents / 1 curve • Exceed design criteria • Reduced grades • Cross-section • 3.6 meter lanes • 2.5 meter shoulders • Improved roadside
Step 1: Project Segmentation • Start and end points for the safety model must be the same for a fair comparison • Segmentation of corridor should be primarily based on horizontal alignment • Tangent 1 / Curve 2 / Tangent 3 / …. • Segmentation could also be based on significant changes in the design or operation • Change in traffic volume • Change in design elements (e.g., tunnel) • Others as required
Step 3: Select and Apply “Base” CPM • Select CPM for each option / each facility: • “Existing” and “Proposed Improvement” • Use CPM to calculate the expected normal collision frequency • Corridors are: • Segment / Rural / Arterial / Undivided / 2-Lane • Use RAU2 models (PDO and Severe)
Step 4: Select Features for Analysis • Need to determine what design elements should be included in the safety model • Typically include (segments): • Lane widths (✔) • Shoulder widths (✔) • Horizontal curve (✔) • Grade (✔) • Access Frequency • Roadside Hazard Level (✔) • Median Treatment • Design Consistency (✔)
Step 5: Determine CMFs • Lane Width • Base Case = 3.0 meters • Option 1 = 3.6 meters
Step 5: Determine CMFs • Lane Width • Base Case = 3.0 meters • CMF Target = 1.30 • Target = OR + HO • OR + HO = 0.347 • CMF Total = 1.104
Step 5: Determine CMFs • Lane Width • Option 1 = 3.6 meters • CMF Target = 1.01 • Target = OR + HO • OR + HO = 0.347 • CMF Total = 1.003
Step 5: Determine CMFs • Shoulder Widths • Base Case = 1.5 meters • Option 1 = 2.5 meters
Step 5: Determine CMFs • Shoulder Widths • Base Case = 1.5 meters • CMF = 1.07 • Target = ORR • ORR = 0.177 • CMF Total = 1.012
Step 5: Determine CMFs • Shoulder Widths • Option 1 = 2.5 meters • CMF = 0.86 • Target = ORR • ORR = 0.177 • CMF Total = 0.975
Step 5: Determine CMFs • Horizontal Alignment (for curves only) • Base Case • C2 = 1.24 Target = ALL • C4 = 1.88 Target = ALL • C6 = 1.30 Target = ALL • C8 = 1.08 Target = ALL • Option 1 • C2 = 1.01 Target = ALL
Step 5: Determine CMFs • Roadway Grade • Base Case • T1 to T5 = 6% Grade, CMF = 1.100, Target = ALL • T7 to T9 = 8% Grade, CMF = 1.137, Target = ALL • Option 1 • T1 and T3 = 2% Grade, CMF = 1.033, Target = ALL
Step 5: Determine CMFs • Roadside Hazard Rating • Base Case = RHR = 6 • CMF = 1.22 • Target = ALL
Step 5: Determine CMFs • Roadside Hazard Rating • Option 1 = RHR = 3 • CMF = 1.00 • Target = ALL
Step 5: Determine CMFs • Design Consistency • Base Case • C2 = 1.326 • C4 = 1.642 • C6 = 1.421 • C8 = 1.200 • Option 1 • C2 = 0.990
Step 5: Calculate Composite CMF • Calculate composite CMF
Step 6: Estimate Safety Performance Safety Performance = CPM x CMFs
Step 6: Estimate Safety Performance Safety Performance = CPM x CMFs
Step 7: Calculate Collision Costs • With safety performance known, it is possible to calculate the collision costs associated with each design scenario. • Use BC MOT average collision cost values • Fatal collision = $5,600,000 / incident • Injury collision = $100,000 / incident • P.D.O. collision = $7,350 / incident • Use collision severity distribution to determine the average cost of a severe collision (F + I) • (F + I) collision = $290,000 / incident
Step 7: Calculate Collision Costs • Base Case: FrequencyCollision Cost • PDO Collisions / yr = 6.0 / yr = $44,000 / yr • F + I Collisions / yr = 4.4 / yr = $1,276,000 / yr • Total Collisions / yr = 10.4 / yr = $1,320,000 / yr • Option 1: • PDO Collisions / yr = 2.8 / yr = $21,000 / yr • F + I Collisions / yr = 2.1 / yr = $609,000 / yr • Total Collisions / yr = 4.9 / yr = $630,000 / yr • Safety Benefit: Option 1 = 5.5 / yr = $690,000 / yr
Step 7: Calculate Collision Costs • Also possible to calculate the life-cycle collision costs (discounted) as inputs to a MAE, a business cases or other project justifications. • Safety Model is run for • Opening Day; • Horizon Year; • Any interim years when road changes (that affect safety performance) are made • Collision costs can be reduced to a NPV and combined with other project evaluation criteria • Mobility, environmental, economic development, etc.
Summary • CPMs and CMFs can be used to develop a ‘Safety Model’ that allows for the explicit quantification of safety performance • CPM estimates the ‘normal’ safety performance • CMF estimates how each design feature affects safety • Safety modeling considers the specific design features of a facility to estimate the collision frequency • Results can be converted into collision costs and combined with other evaluation criteria to assess and justify highway improvement expenditure.