Download
1 / 51
510 likes | 524 Views
This research focuses on the environmental impact of development assistance and examines the allocation patterns, effectiveness, and accountability of environmental aid. It also explores the factors influencing donor governments' spending on environmental assistance and identifies the countries that receive the most environmental aid. The study aims to answer key research questions related to the greening of aid and the disparities in donor commitments.

E N D
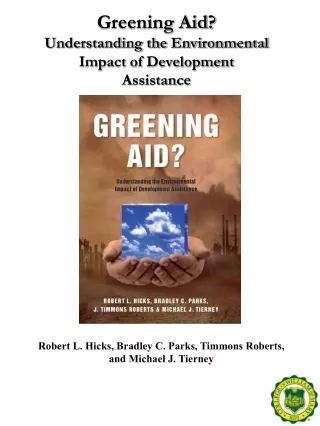
Greening Aid?Understanding the Environmental Impact of Development Assistance Robert L. Hicks, Bradley C. Parks, Timmons Roberts, and Michael J. Tierney
Why Does This Topic Matter? A lack of reliable information means limited accountability Environmental aid is key to securing developing country participation in environmental agreements Allocation patterns shape the expected effectiveness of environmental aid
Previous research on environmental aid lacks reliable data… “Data are simply not collected and analyzed in a manner that informs policy makers interested in the issue” The Intergovernmental Panel on Climate Change, 2001 “ [We face] a number of difficulties in calculating the precise amount of environmental expenditure. There is no generally accepted definition of an ‘environmental project’.” European Commission, 2006 “Available data are highly distorted by the lack of any common definition of what is or is not ‘environmental assistance.’” Connolly et al., 1996, Institutions for Environmental Aid
The Project-Level Aid (PLAID) Research Initiative Launched in 2003 Bilateral and multilateral aid data collected at the project level for 1970-2000 period 1. 21 major bilateral donors, 40+ multilateral donors 2. Total Project Count: 428,663 3. Total Dollars: $2.3 trillion All projects systematically coded based on their expected environmental impact
Why is project-level coding important? PLAID coding: Is based on actual project descriptions Does not assume homogenous sectors
All projects double-coded into three primary categories Environmental Strictly Defined (ESD)Projects: Access to Clean Water Biodiversity Carbon Dioxide Reduction Ecosystem Preservation Forestation/Reforestation Renewable Energy Soil Conservation Dirty Strictly Defined (DSD) Projects: Air and Road Transport Chemicals Dams Industries: brick-making, plaster, rubber, etc Logging Mining Natural Gas, Oil and Coal Neutral (N) Projects: Banking/Finance Business Development Disaster Relief/Prevention Education Food Safety/Quality Health Trade
Greening Aid: 4 Research Questions • Has aid been greened, and if so, by how much? • 2. Which donor governments spend the most on foreign assistance for the environment and why? • 3. Why do some donor governments delegate responsibility for allocating and implementing environmental aid to multilateral agencies when they could simply give it away themselves? • 4. Which countries receive the most environmental aid and why?
Research Question #1 Has aid been greened, and if so, by how much?
All environmental projects also coded along green/brown dimension “Green”Projects (addressing Regional and Global Public Goods) Carbon Dioxide Reduction Ecosystem Preservation Energy Conservation Energy Efficiency Renewable Energy Biodiversity Reforestation Population/ Family Planning Acid Rain Wildfire Protection Eco Tourism “Brown” Projects (addressing Local Public Goods) Clean water Sewage/Wastewater Treatment Urban Environmental Issues Environmental Health Hazards Soil Protection/Conservation Erosion Control Land Reclamation Drought Control Soil Fertility Solid Waste Treatment Air pollution (not climate change or acid rain) Coastal Management Natural Resource Management Safe Handling of Toxic Materials
A Closer Look at Four Environmental Sub-Sectors: Water, Biodiversity, Climate Change, and Desertification
The Rio Bargain: Promises vs. Performance At Rio, 700-page “Agenda 21” document was designed to break impasse between developed and developing countries. It called for a significant increase in “new and additional” ODA for global and local environmental problems
Research Question #2: Which donor governments spend the most on foreign assistance for the environment and why?
Why are some donors greener than others? Factors that might explain commitment to/interest in environmental projects 1. National wealth (GDP/capita) 2. Post-materialist values (World Values Survey) 3. Domestic environmental policy preferences (EPI) 4. International environmental policy preferences (WEF compliance with env. treaties) 5. “Green and greedy coalitions” (enviro NGO concentration * relative size of enviro tech industry) 6. Dirty industry lobbying strength (IGC) 7. Domestic political institutions (leftist party strength, corporatism, veto players, checks and balances)
Statistical Findings 1. Our models better explain the drop in “dirty” aid than the rise in environmental aid 2. Wealthier and more post-materialist countries invest less in dirty projects, but not necessarily more in environmental projects 3. Countries with stronger “coalitions of the green and greedy” spend less on dirty aid and more on green aid 4. Countries with higher rates of environmental treaty ratification and compliance have larger environmental aid budgets
Research Question #4 Which countries receive the most environmental aid and why?
Who are the biggest recipients of environmental aid? Top Ten Environmental Aid Recipients, 1990-1999
Factors that might explain inter-recipient allocation patterns Global environmental significance (natural capital stock) Local environmental damage (water quality index) Regional (environmental) significance (physical distance between donor and recipient) Participation in international environmental agreements (ratification of 9 major treaties) Transparency/availability of environmental information (CITES reporting requirements met) Strength of public institutions (Govt. Effectiveness) Sound economic policies (Regulatory Quality) Democracy (POLITY IV) Colonial legacy (status as of 1945) Recipient need (poverty; population size) Political loyalty (UN voting patterns) Existing commercial relationships (trade between donor and recipient) Why do some countries receive more environmental aid than others?
Statistical Findings Countries of global environmental significance receive more green aid from bilateral and multilateral donors Physical proximity to donor (possible proxy for regional environmental significance) is a good predictor of brown aid, but not green aid Local environmental damage is not a strong predictor, but significant measurement problems Donors appear to screen for recipient credibility (i.e. effective governments, strong environmental policies and institutions) more extensively at the “gatekeeping” stage than the “amount” stage of the allocation process Bilateral donors favor recipient countries with higher rates of environmental treaty ratification when doling out green aid
Statistical Findings (cont.) Bilateral trading partners are favored (across all sectors) Colonial ties matter (across all sectors) Proxy for political loyalty (UN voting record) yielded unexpected results: recipients that vote similarly to donor country receive less environmental (and dirty) aid. Bilateral donors target poorer countries more effectively than multilateral donors Bilateral and multilateral donors favor more populous countries
Limitations of the Study 1. Cross-national data masks significant variation across regions and districts 2. Models assume allocation in one aid sector doesn’t influence others 3. Variation in grant element across projects 4. Mainstreaming of green aid 5. Possible “migration” of dirty projects to export promotion agencies, political risk insurance agencies, and private banks 6. Coding scheme says nothing about actual environmental impact
The Importance of Independent Coding/Evaluation Donors are under pressure to show they are “doing something about the environment” The Case of DFID 1. DFID’s Policy Information Marker System (PIMS) provides an informative comparison with PLAID-coded data 2. DFID reports that projects with positive environmental objectives accounted for 25% of its bilateral aid in the 1990s 3. According to a project-by-project analysis of the PLAID data, the actual number is closer to 10%
The Future of Environmental Aid: Climate Change Projected Cost of Mitigation As of 2030, $100 billion a year will be needed to finance mitigation activities in developing countries Projected Cost of Adaptation By 2030, $28-67 billion a year will be needed to finance adaptation activities in developing countries
Future Directions 1. Making PLAID an easy-to-use, timely, and comprehensive database on international development finance for donors, NGOs, activists, and researchers 2. By end of 2008, PLAID data updated through 2006 3. Coverage of “emerging” donors (i.e. China, Poland, Venezuela…) 4. Sector-specific and sub-sector specific aid effectiveness research
Existing “Macro” Research on Aid Effectiveness Agricultural Aid Biodiversity Aid Democracy Assistance Total Official Development Assistance Economic Growth or Infant Mortality Disaster Relief Peacekeeping Child Survival assistance *Existing literature focuses on relationship between total aid flows and causally distant or unrelated development outcomes Family Planning Assistance Civil Society Support Education Assistance
PLAID’s Potential Contribution to Aid Effectiveness Literature Water Quality/Access to Potable Water Water Aid Prevalence Rates/Access to ARVs HIV/AIDS assistance Agricultural Productivity Agricultural Aid % of species threatened & vegetation density Biodiversity Aid Education Aid Enrollment/Literacy Rates % of pop made homeless by climate disasters Climate Adaptation Aid
PLAID’s Potential As Tool for Donor Coordination A growing literature suggests that donor coordination has a significant impact on the success of development projects. (Knack and Rahman 2004; Acharya et al. 2003; Easterly 2003). 1. Cuts reporting requirements 2. Reduces monitoring costs 3. Minimizes overlap and cross-purposes 4. Awareness of projects in same places and sectors 5. Reduces duplication of assessments and reviews 6. Enables sharing of expertise
Thank you. Comments? Contacts us at: irtheoryandpractice.wm.edu
Environmental “Mainstreaming” vs. Rhetoric at the World Bank
But what about aid that supports environmentally-damaging projects?
Research Question #3 Why do some donor governments delegate responsibility for allocating and implementing environmental aid to multilateral agencies when they could simply give it away themselves?
% of Environmental Aid Channeled Through Multilateral Agencies, 1980-1999
Why delegate? Strong correlation between dirty aid delegation and brown aid delegation (bivariate correlation = .66) But a significantly weaker correlation between dirty aid delegation and green aid delegation (bivariate correlation = .39) Suggests that there may be a separate logic motivating the delegation of green aid
Why do donor governments delegate to multilaterals? Factors that might explain supra-national delegation of environmental aid Size of Country (population size) Cost of bilateral aid delivery (% of bilateral aid budget spent on administrative overhead) “Tied hands” at home Tied aid as a percentage of total aid Degree to which bilateral aid allocated according to geo-strategic criteria Degree to which bilateral aid favors trading partners Degree to which donor is able to allocate bilateral aid according to “eco-functional” criteria (strong govt. institutions, track record of environmental treaty compliance, ability to deliver global environmental benefits)
Statistical Findings Neither tied aid nor administrative cost of delivery a significant predictor of multilateralism, but serious measurement problems Small countries favor having multilateral agencies allocate and implement green aid Countries with “tied hands” (i.e. where commercial and geostrategic interests drive bilateral aid allocation) favor supranational delegation Donors with higher rates of environmental treaty compliance prefer to allocate green aid through bilateral channels However, countries with the domestic policy space to allocate bilateral aid efficiently actually favor delegation of environmental aid to multilateral agencies
PLAID Applications Outside of Environment Sector Ex: Aid to Honduras for agricultural productivity and market access (1990-2000) OECD’s CRSsectors too general PLAID search results Keywords: productivity, infrastructure, and transportation projects Project Count: 67 Non-CRS Projects: 16 (24%) Projects spanned 16 CRS sectors Example: Projects for “increased agricultural productivity” in four CRS sectors 31120 (Agricultural Development) 31130 (Agricultural Land Resources) 31192 (Plant Post-Harvest Protection & Pest Control) 41010 (Environmental Policy & Administration Management)
PLAID Analysis of aid for climate change adaptation and mitigation in 115,035 projects randomly selected from the 2000-2006 OECD dataset (initial findings) Project-Level Aid research project, part of the AidInfo Consortium, July 2008 J. Timmons Roberts and Research Assistants: Dina Abdel-Fattah, Samantha Hynes, Tommy Jones, Christian Peratsakis, and Kara Starr College of William and Mary, USA jtrobe@wm.edu
Mitigation Adaptation Funding for Mitigation and Adaptation, 2000-06 • Fig 3b continues to show an upward trend. This time, the graph shows an estimate of dollars spent on both mitigation and adaptation climate change aid. The dominant expenditures are on mitigation aid.
All Projects Included No Hydropower Projects Climate Aid as a % of Total Aid, Less Hydropower • Fig 3a shows the percent of dollars spent on climate change projects according to the PLAID coding scheme. This is from a random sample an average of 16,433 projects per year.
Largest Climate Change Donors, 2000-06 • Fig 3d shows the biggest donors by the percent of climate change funding that they have given. The Inter-American Development Bank is the largest donor, having funded several large hydropower projects.
Climate Funding By Sector, 2000-06 • Fig 3c shows an estimate of total dollars spent on each type of climate change according to the PLAID scheme.