Download
1 / 8
110 likes | 640 Views
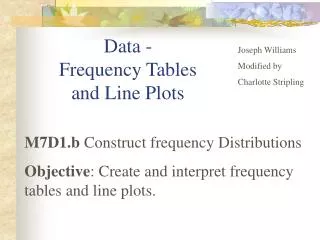
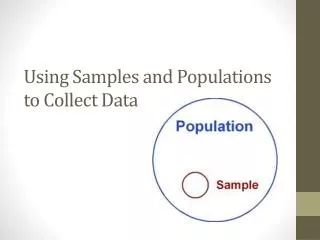
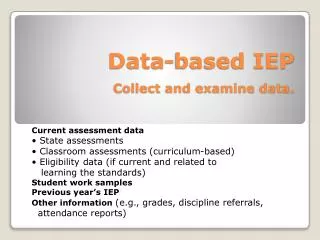
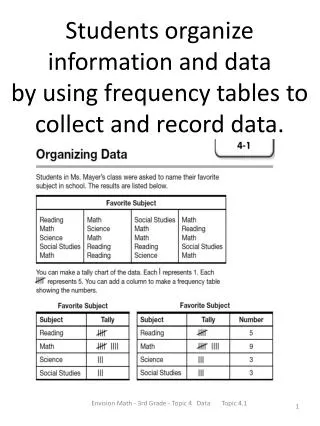
Students organize information and data by using frequency tables to collect and record data. Students will construct and analyze data on a number line by using line plots. Students read and interpret data by using a pictograph and a bar graph.

E N D
Students organize information and data by using frequency tables to collect and record data. Envision Math - 3rd Grade - Topic 4 Data Topic 4.1
Students will construct and analyze data on a number line by using line plots. Envision Math - 3rd Grade - Topic 4 Data Topic 4.1
Students read and interpret data by using a pictograph and a bar graph. Envision Math - 3rd Grade - Topic 4 Data Topic 4.3
Students will organize data by making a pictograph from a frequencytable or chart. Envision Math - 3rd Grade - Topic 4 Data Topic 4.4
Mathematicians make bar graphs to represent the data in a frequency table or tally chart by using a scale to represent the data. Envision Math - 3rd Grade - Topic 4 Data Topic 4.5
Students display data by choosing graphs that best represent the collected data. Envision Math - 3rd Grade - Topic 4 Data Topic 4.6
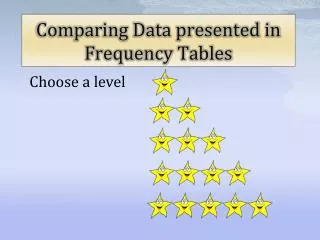
Students solve problems by using tables and graphs to make comparisons. Envision Math - 3rd Grade - Topic 4 Data Topic 4.7
Math Students “Show What They Know”by doing an assessment on Topic 4 - Data. Envision Math - 3rd Grade - Topic 4 Data Topic 4