Unraveling Population Substructure Through Information Theory Techniques
This research explores the concept of population substructure, where distinct subgroups of organisms evolve separately, creating genetic variation within and between these groups. Traditional distance-based clustering methods face challenges with overlapping subpopulations. By employing Information Theory principles, particularly mutual information, we enhance the detection of these substructures. Our algorithm iteratively refines clusters based on genetic sample data to improve accuracy in identifying population subgroups. The results demonstrate significant success in accurately assigning samples, contributing to better insights in disease association studies.

Unraveling Population Substructure Through Information Theory Techniques
E N D
Presentation Transcript
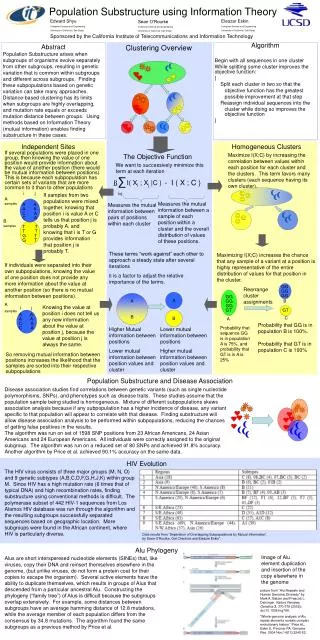
Population Substructure using Information Theory Edward Shyu Computer Science and Engineering University of California, San Diego Eleazar Eskin Computer Science and Engineering University of California, San Diego Sean O’Rourke Computer Science and Engineering University of California, San Diego Sponsored by the California Institute of Telecommunications and Information Technology Clustering Overview Abstract Population Substructure arises when subgroups of organisms evolve separately from other subgroups, resulting in genetic variation that is common within subgroups and different across subgroups. Finding these subpopulations based on genetic variation can take many approaches. Distance-based clustering has its limits when subgroups are highly overlapping, and mutation rate equals or exceeds mutation distance between groups. Using methods based on Information Theory (mutual information) enables finding substructure in these cases. Algorithm Begin with all sequences in one cluster While splitting some cluster improves the objective function: { Split each cluster in two so that the objective function has the greatest possible improvement at that step Reassign individual sequences into the cluster while doing so improves the objective function } Independent Sites Homogeneous Clusters The Objective Function If several populations were placed in one group, then knowing the value of one position would provide information about the value of another position (there would be mutual information between positions). This is because each subpopulation has certain sets of variants that are more common to it than to other populations Maximize I(X;C) by increasing the correlation between values within each position for each cluster and the clusters. This term favors many clusters (each sequence having its own cluster). We want to successively minimize this term at each iteration ∑ i<j ß I( Xi ; Xj |C ) - I ( X ; C ) i j If samples from two populations were mixed together, knowing that position i is value A or C tells us that position j is probably A, and knowing that i is T or G provides information that position j is probably T. A samples Measures the mutual information between a sample of each position within a cluster and the overall distribution of values of these positions. A A Measures the mutual information between pairs of positions within each cluster A A C A C A B samples T T T T G T G T These terms “work against” each other to approach a steady state after several iterations ß is a factor to adjust the relative importance of the terms. Maximizing I(X;C) increases the chance that any sample of a variant at a position is highly representative of the entire distribution of values for that position in the cluster. If individuals were separated into their own subpopulations, knowing the value of one position does not provide any more information about the value at another position (so there is no mutual information between positions). GG Rearrange cluster assignments GG A GG A B GG GG B A samples GG Knowing the value at position i does not tell us any new information about the value at position j, because the value at position j is always the same. i j GT GT B A A C A A A C A Probability that GG is in population B is 100%. C A Probability that sequence GG is in population A is 75%, and probability that GT is in A is 25% Higher Mutual information between positions Lower mutual information between position values and cluster Lower mutual information between positions Higher mutual information between position values and cluster Probability that GT is in population C is 100% So removing mutual information between positions increases the likelihood that the samples are sorted into their respective subpopulations Population Substructure and Disease Association Disease association studies find correlations between genetic variants (such as single nucleotide polymorphisms, SNPs), and phenotypes such as disease traits. These studies assume that the population sample being studied is homogeneous. Mixture of different subpopulations skews association analysis because if any subpopulation has a higher incidence of disease, any variant specific to that population will appear to correlate with that disease. Finding substructure will allow disease association analysis to be performed within subpopulations, reducing the chances of getting false positives in the results. The algorithm was run on set of 1598 SNP positions from 23 African Americans, 24 Asian Americans and 24 European Americans. All individuals were correctly assigned to the original subgroup. The algorithm was run on a reduced set of 80 SNPs and achieved 91.8% accuracy. Another algorithm by Price et al. achieved 90.1% accuracy on the same data. HIV Evolution The HIV virus consists of three major groups (M, N, O) and 9 genetic subtypes (A,B,C,D,F,G,H,J,K) within group M. Since HIV has a high mutation rate (6 times that of typical DNA) and high recombination rates, finding substructure using conventional methods is difficult. The polymerase subset of 442 HIV-1 sequences from Los Alamos HIV database was run through the algorithm and the resulting subgroups successfully separated sequences based on geographic location. More subgroups were found in the African continent, where HIV is particularly diverse. Data results from “Separation of Overlapping Subpopulations by Mutual Information”, by Sean O’Rourke, Gal Chechick and Eleazar Eskin”. Alu Phylogeny Image of Alu element duplication and insertion of the copy elsewhere in the genome Alus are short intersperesed nucleotide elements (SINEs) that, like viruses, copy their DNA and reinsert themselves elsewhere in the genome, (but unlike viruses, do not form a protein coat for their copies to escape the organism). Several active elements have the ability to duplicate themselves, which results in groups of Alus that descended from a particular ancestral Alu. Constructing the phylogeny (“family tree”) of Alus is difficult because the subgroups overlap extensively. For example, some distances between subgroups have an average hamming distance of 12.8 mutations, while the average member of each population differs from the consensus by 34.8 mutations. The algorithm found the same subgroups as a previous method by Price et al. picture from “Alu Repeats and Human Genomic Diversity” by Mark A. Batzer and Prescott L. Deininger. Nature Reviews Genetics3, 370-379 (2002); doi:10.1038/nrg798. “Whole-genome analysis of Alu repeat elements reveals complex evolutionary history.” Price AL, Eskin E, Pevzner PA. Genome Res. 2004 Nov;14(11):2245-52.