Download
1 / 58
580 likes | 725 Views
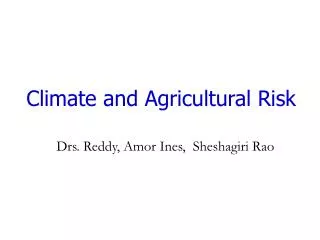
Dynamism of Agricultural Risk. Drs. D. R. Reddy, Amor Ines, Sheshagiri Rao. Overview. Decision Making Under Uncertainty Risk Aversion and Optimization Example of optimizing maize production in Kenya Analyzing climate risks and risk management approaches at community/village level

E N D
Dynamism of Agricultural Risk Drs. D. R. Reddy, Amor Ines, Sheshagiri Rao
Overview • Decision Making Under Uncertainty Risk Aversion and Optimization Example of optimizing maize production in Kenya • Analyzing climate risks and risk management approaches at community/village level Example 1: Srirangapura Village, Mahabubnagar Example 2: groundnut in Anantapur • Using climate information to manage crop mixes: examples from Mahabubnagar
Decision Making Under Uncertainty Amor Ines
Risks Probability density Climatic outcome (e.g., rainfall)
Optimization Poorly-behaved response surfaces Computationally-intensive Robust methods: Simulated annealing Genetic algorithms Compromise: grid search
Value for maize management, Kenya Decisions that are optimal on average are usually far from optimal. Skillful forecasts can inform management that is closer to optimal for given weather conditions. average weather 1995 (dry) 1994 (wet) yield income optimal N
a c e b d f
CLIMATE RISK- SEMI ARID VILLAGE AT MEHABUBNAGAR • CROP (Specific) - RAINFED MAIZE, RAINFED Bt.COTTON • LIVESTOCK (Specific) - SHEEP • RISK MGT AT • FAMILY LEVEL – LIVELIHOOD PERSPECTIVE • COMMUNITY LEVEL • GOVERNMENT AND BANK • VARIABILITY OF RISK • AT FARM SCALE – IN TIME AND SPACE • LIVELIHOOD OPTIONS • COMBINATION OF ENTERPRISES
Analyzing climate risks and risk management approaches at community/village level Sheshagiri Rao
Sheep – One of the highest district level Population in the nation (AP has the highest amongst states)
CROP -TOTAL CLIMATE RISK COMPONENT • From end to end- Land preparation, crop sowing • TO Harvest and post harvest operations • Consider both • Direct impact- by moisture stress, water logging and on Crop physiology • Indirect impact – by triggering rapid increase of pests, diseases and vector populations that are already endemic. • In any particular year a particular combination of such ‘adverse events’ would occur • It is possible to construct simple models for such climate impact by using • Existing literature • Expert knowledge of farmers, field researchers
NOTE • All further slides refer to Rainfed groundnut at Anantpur • These are illustrative of methodology • similar questions (to the ones mentioned here) were asked by farmers in the study village.
Plot level = Profit / loss is rain+ many others05 =43 cm, 06=32cm, 07=52cm, 08=57cm
At plot level- Yield variation and rain- relationship is much weaker than EXPECTED05 =43 cm, 06=32cm, 07=52cm, 08=57cm
Anantpur District average groundnut yield- (1975-1995) - Avg rain-47 cm Cost of Cultivation
6 villages in Anantpur region • Located in 3 separate Mandals, distributed in an area of about 4000 sq km • Data from Marginal and small farmers, Vulnerable sections to climate risk • Sample of 20-40% of the total families in the community • Family wise data collection from 2005 to 2008
Community level Livelihood options at 3 villages of Anantpur
Reasons for first debt ? – crop (during bad year), bore wells, sheep are the big reasons