Download
1 / 24
240 likes | 355 Views
ST. LOUIS REGION AIR QUALITY REPORT. EWGCOG Staff Report July 7, 2006. St. Louis Air Quality History. Clean Air Act Amendments of 1990 Moderate Ozone Non-Attainment Area Completion of 15% Rate-of-Progress State Implementation Plans (SIPs) Attained 1-Hour Ozone Standard in 2002.

E N D
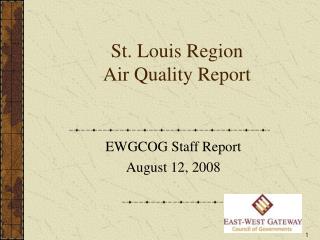
ST. LOUIS REGIONAIR QUALITY REPORT EWGCOG Staff Report July 7, 2006
St. Louis Air Quality History • Clean Air Act Amendments of 1990 • Moderate Ozone Non-Attainment Area • Completion of 15% Rate-of-Progress State Implementation Plans (SIPs) • Attained 1-Hour Ozone Standard in 2002
Ozone – What is it? • Ground level ozone found in the lower atmosphere • Created by chemical reaction of volatile organic compounds (VOCs) and oxides of nitrogen (NOx) in strong sunlight • Weather conditions needed are high temperatures (900+), intense sunlight and low wind speeds
Four Sources of Volatile Organic Compounds (VOC) St. Louis Regional Clean Air Partnership
Health Effects of Ozone • Headaches, fatigue, shortness of breath, coughing, wheezing • Irritates eyes, nose and respiratory track • Aggravates chronic heart disease and chronic respiratory ailments • Decreases resistance to infection • Triggers asthma attacks
New Standards and SIPs • New 8-hr Ozone Standard in 2004 • Standard is 80 parts per billion (ppb) averaged over an 8 hour period • More protective of human health • St. Louis designated as Moderate area
Violation • Violation of the standard is determined by averaging the 4th highest annual maximum average by monitor over a 3 year period • Based on 2004-2006 data, Orchard Farm monitor is in violation (still to be verified)
2004—2006 4th Highest 8-Hr Ozone Averages (ppb) as of July 4, 2006
Fine Particles or PM2.5 • December 17, 2004 USEPA identified those areas which do not meet the fine particle or PM2.5 standard • 20 states were notified • All or part of 224 counties and Washington, D.C. were designated as non-attainment
Fine Particles or PM2.5 • PM is a mix of solid particles and liquid droplets suspended in the air • Fine PM is less than or equal to 2.5 microns in diameter (1/30 the width of a human hair) • Made up of a number of components
Fine Particles or PM2.5 • Components include acids, organic chemicals, metals, soil or dust particles • Can be emitted directly • Can be chemically formed in the atmosphere from gases such as SO2, NOx and VOC
Fine Particles or PM2.5 Sources • Smoke from fires • Power plants • Industrial activities • Vehicle exhaust
Gateway’s Air Quality Planning Activities • Facilitate SIP process for Ozone and PM2.5 • Coordinate the AQAC • Prepare Air Quality Conformity Determination • Coordinate the IACG • Ozone Data Sharing Project • Special Projects
Important Dates • June 15, 2007 – 8-Hour Ozone SIPs to be submitted to USEPA • April 5, 2008 – PM2.5 SIPs to be submitted to USEPA • June 15, 2010 – Area to attain 8-Hour Ozone standard • April 5, 2010 – Area to attain PM2.5 standard
Ozone Data Sharing Project • Ozone season is April 1 – October 31 • EWGCOG acts as clearinghouse for data • Initial quality assurance screening • Record in a spreadsheet computer program
1984 – Basic I/M Test 1993 – Low RVP Gasoline (7.2 psi) 1988 – Stage II Vapor Recovery 1995 – Low RVP Gasoline (7.0 psi) 1990 – Computerized I/M Testing 1999 – Federal Reformulated Gasoline Program 1991 – Low RVP Gasoline (7.8 psi) 2000 – Centralized I/M Program
Things to do to Reduce Ozone Levels – On Days Forecasted to have High Ozone Levels • Set air conditioner no lower than 78o to conserve energy • Share a ride or use mass transit; bicycle or walk errands when possible • Avoid using oil- and solvent-based paints, degreasers or lighter fluid • Defer use of gasoline-powered lawn and garden equipment • Refuel cars and trucks after dusk to reduce daytime pollution releases • Combine errands and reduce trips • Limit vehicle idling when possible
Ozone and Transportation Facts • People in St. Louis drive over 75 million miles per day • Carpooling saves 320 lbs of emissions and $1,000 – per person/year • Two MetroLink tracks = 16 lanes • A full MetroBus at rush hour removes 40 cars from the highway St. Louis Regional Clean Air Partnership
For Additional Information • On-line Air Quality Resource Center • www.ewgateway.org/environment/aq/aq.htm