Download

1 / 54
540 likes | 573 Views
New Designs for Phase III Clinical Trials. Richard Simon, D.Sc. Chief, Biometric Research Branch National Cancer Institute http://brb.nci.nih.gov. BRB Website http://brb.nci.nih.gov. Powerpoint presentations & reprints BRB-ArrayTools software

E N D
New Designs for Phase III Clinical Trials Richard Simon, D.Sc. Chief, Biometric Research Branch National Cancer Institute http://brb.nci.nih.gov
BRB Websitehttp://brb.nci.nih.gov • Powerpoint presentations & reprints • BRB-ArrayTools software • Human tumor annotated gene expression data archive • Web based sample size planning • Phase II/III trials • Clinical Trials with Predictive Biomarkers • Development of prognostic signatures
Topics for Discussion • Integrated Phase II/III Clinical Trials • Using genomic predictive biomarkers in phase III clinical trials
Integrated Phase II/III Clinical Trials Sally Hunsberger, Yingdong Zhao, and Richard Simon
Interpretation of single arm phase II study results is problematic when • a new drug is used in combination with other agents • or when progression free survival is used as the endpoint. • Randomized phase II studies are more informative for these objectives but increase both the number of patients and time required to determine the value of a new experimental agent.
Randomized Controlled Phase II Trial • Randomization to standard regimen or regimen with new drug • Endpoint is time to progression regardless of whether it is an accepted phase III endpoint • One-sided significance level can exceed .05 for analysis and sample size planning • Simon R et al. Clinical trial designs for the early clinical development of therapeutic cancer vaccines. Journal of Clinical Oncology 19:1848-54, 2001 • Korn EL et al. Clinical trial designs for cytostatic agents: Are new approaches needed? Journal of Clinical Oncology 19:265-272, 2001 • Rubinstein LV, Korn EL, Freidlin B, Hunsberger S, Ivy SP, Smith MA. Design issues of randomized phase 2 trials and a proposal for phase 2 screening trials. Journal of Clinical Oncology 2005;23:7199-7206.
Randomized controlled phase II trials with time to progression endpoint require much larger sample sizes and longer follow-up than traditional single arm phase II trials unless • A large treatment effect is targeted • Time to progressive disease is short
Number of Events Required for Randomized Trial With Time to Event Endpoint For =0.05, =0.20, hr=1.5, E=75 events are required For =0.10, 55 events
Randomized discontinuation trials can require larger sample sizes than randomized controlled phase II trials in some cases • Freidlin B and Simon R. An evaluation of the randomized discontinuation design. J Clin Oncol 23:1-5,2005.
We compared different phase II study strategies for developing a new regimen compared to a control for improving OS • Perform phase III of OS if single arm phase II of PFS is significant • Perform phase III of OS if randomized controlled phase II of PFS is significant • Integrated phase II/III • Phase III of OS with futility analysis of PFS • No phase II, go directly to phase III of OS with futility analysis of OS • Comparison based on total number of patients and total length of time to conclusion of drug efficacy on overall survival.
Pancreatic Cancer Example • median OS is about 6 months. • Improvement in OS to 7.8 months is used for sizing phase III trial (hazard ratio of 1.3). • Assuming an accrual rate of 15 patients per month with a minimum follow up of 6 months would require 46.1 months of accrual or 692 patients • Median PFS about 3 months • Detect hazard ratio of 1.5 in PFS in phase II analysis with 90% power using 1-sided .1 significance
Integrated phase II/III study design • Patients will be accrued until time t1. At t1 accrual will be suspended and patients will be followed for a minimum time f1. • After t1+f1 a comparison of the treated versus control groups based on progression-free survival (PFS) will be performed. If the p-value for PFS in this interim analysis is not less than a specified threshold α1, accrual will terminate and no claims for the new treatment will be made. • Otherwise, accrual will resume until a total of M patients are accrued. After accruing M patients, follow-up will continue for an additional minimum time fo. At the end of the study OS will be evaluated on all M patients. The total sample size M is that of the phase III study.
For the integrated phase II/III and for the phase III with a futility analysis we determined t1 and 1 so that the overall study power (probability of concluding a benefit on OS when starting from phase II) will be maintained at 81%. • This 81% is the power for the strategy of a randomized phase II study with 90% power for PFS followed by a randomized phase III study with 90% power for OS. • For the integrated phase II/III and the futility design we evaluate E[N] and E[T] for different 1 values but always adjusted t1 to maintain 81% power.
We evaluated the designs under: • No treatment effect on either PFS or OS (global null) • Treatment effect on PFS and OS (global alternative) • This approach assumes that PFS is a “partial surrogate” for OS; i.e. effect of treatment on PFS in necessary but not sufficient to ensure effect of treament on OS • This approach can be used with molecular or imaging intermediate endpoint biomarkers instead of PFS
For the single arm phase II study, miss-specifying the control median PFS time is a serious problem • When there is no treatment benefit, Table 1a shows the increase in the probability of proceeding to phase III if the patients selected for the phase II trial are slightly more favorable than expected; e.g.l median control PFS is under specified by 2 weeks and 1 month.
Table 1b shows that specifying the control median too high cuts into the probability of concluding a benefit on OS when a benefit exists. The overall probability is expected to be .81 but it is reduced to .51 or .09 for a 2 week or 1 month over specification.
Although the single arm phase II study may appear to speed up drug development, even minimal prognostic bias in comparison to historical controls can have major impact on producing misleading results which either lead to futile phase III trials or result in missing active agents.
Dixon, DO, and Simon, R. Sample size considerations for studies comparing survival curves using historical controls. J. Clin. Epidemiology 41: 1209-1214, 1988. • Thall, PF, and Simon, R. Incorporating historical control data in planning phase II clinical trials. Stat. in Med. 9:215-228, 1990. • Thall, P F and Simon R. A Bayesian approach to establishing sample size and monitoring criteria for phase II clinical trials. Controlled Clinical Trials 15:463-481, 1994. • Thall, PF, Simon R. and Estey E. Bayesian designs for Clinical trials with multiple outcomes.Statistics in Medicine 14:357-379, 1995 • Thall PF, Simon R, Estey E: A new statistical strategy for monitoring safety and efficacy in single-arm clinical trials. Journal of Clinical Oncology 14:296-303, 1996.
Number of Patients on Experimental Treatment to have 80% Power for Detecting 15% Absolute Increase (=.05) in PFS vs Historical Controls
Table 2 gives the E[T] and E[N] for the designs under the global null and global alternative. All designs have 81% power and type I error rate of less than .05 (2-sided). • Under the global null hypothesis, • The sample size for the integrated design is comparable to that for a separate randomized phase II design. • For the integrated design, futility monitoring on PFS is more effective than futility monitoring on OS because progression events can be observed sooner. • Under the global alternative, there is a dramatic savings in time and patients for the integrated design compared to the sequence of studies.
The interim analysis of PFS may support a claim of accelerated approval if a significance level no greater than .05 is used. • This design would ensure that a randomized phase III trial based on OS was in place at the time that accelerated approval was obtained and would provide a well powered, well designed randomized phase II study with PFS as the basis for the provisional claim.
We have provided a web based computer program that calculates the expected sample size, expected study duration, and power for the integrated phase II/III design and the alternatives compared • http://brb.nci.nih.gov
Using Genomic Predictive Biomarkers in Phase III Clinical Trials
Prognostic & Predictive Biomarkers • Most cancer treatments benefit only a minority of patients to whom they are administered • Being able to predict which patients are likely to benefit would • Save patients from unnecessary toxicity, and enhance their chance of receiving a drug that helps them • Control medical costs • Improve the success rate of clinical drug development
Predictive biomarker • Measured before treatment to identify who is or is not likely to benefit from a particular treatment • ER, HER2, KRAS • Index or classifier that summarizes expression levels of multiple genes
Predictive Biomarkers • In the past often studied as exploratory post-hoc subset analyses of RCTs. • Led to conventional wisdom • Only hypothesis generation • Only valid if overall treatment difference is significant
Drug Development With Companion Diagnostic • Develop a completely specified genomic classifier of the patients likely to benefit from a new drug • Establish analytical validity of the classifier • Use the completely specified classifier to design and analyze a new clinical trial to evaluate effectiveness of the new treatment with a pre-defined analysis plan that preserves the overall type-I error of the study.
Guiding Principle • The data used to develop the classifier must be distinct from the data used to test hypotheses about treatment effect in subsets determined by the classifier • Developmental studies are exploratory • Studies on which treatment effectiveness claims are to be based should be definitive studies that test a treatment hypothesis in a patient population completely pre-specified by the classifier
“Enrichment” Design • Restrict entry to the phase III trial based on the binary predictive classifier, i.e. targeted design
Develop Predictor of Response to New Drug Using phase II data, develop predictor of response to new drug Patient Predicted Responsive Patient Predicted Non-Responsive Off Study New Drug Control
Applicability of Enrichment Design • Primarily for settings where the classifier is based on a single gene whose protein product is the target of the drug • eg trastuzumab • Analytical validation, biological rationale and phase II data provide basis for regulatory approval of the test • Phase III study focused on test + patients to provide data for approving the drug
Evaluating the Efficiency of Enrichment Design • Simon R and Maitnourim A. Evaluating the efficiency of targeted designs for randomized clinical trials. Clinical Cancer Research 10:6759-63, 2004; Correction and supplement 12:3229, 2006 • Maitnourim A and Simon R. On the efficiency of targeted clinical trials. Statistics in Medicine 24:329-339, 2005. • reprints and interactive sample size calculations at http://linus.nci.nih.gov
Develop Predictor of Response to New Rx Predicted Responsive To New Rx Predicted Non-responsive to New Rx New RX Control New RX Control Stratification Design
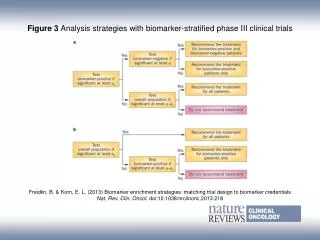
Do not use the diagnostic to restrict eligibility, but to structure a prospective analysis plan • Having a prospective analysis plan is essential • “Stratifying” (balancing) the randomization is useful to ensure that all randomized patients have tissue available but is not a substitute for a prospective analysis plan • The purpose of the study is to evaluate the new treatment overall and for the pre-defined subsets; not to modify or refine the classifier • The purpose is not to demonstrate that repeating the classifier development process on independent data results in the same classifier
R Simon. Using genomics in clinical trial design, Clinical Cancer Research 14:5984-93, 2008
Analysis Plan A(substantiall confidence in test) • Compare the new drug to the control for classifier positive patients • If p+>0.05 make no claim of effectiveness • If p+ 0.05 claim effectiveness for the classifier positive patients and • Compare new drug to control for classifier negative patients using 0.05 threshold of significance
Analysis Plan B(Limited confidence in test) • Compare the new drug to the control overall for all patients ignoring the classifier. • If poverall 0.03 claim effectiveness for the eligible population as a whole • Otherwise perform a single subset analysis evaluating the new drug in the classifier + patients • If psubset 0.02 claim effectiveness for the classifier + patients.
Analysis Plan C(adaptive) • Test for difference (interaction) between treatment effect in test positive patients and treatment effect in test negative patients • If interaction is significant at level int then compare treatments separately for test positive patients and test negative patients • Otherwise, compare treatments overall
Biomarker Adaptive Threshold Design Wenyu Jiang, Boris Freidlin & Richard Simon JNCI 99:1036-43, 2007
Biomarker Adaptive Threshold Design • Randomized trial of T vs C • Have identified a biomarker score B thought to be predictive of patients likely to benefit from T relative to C • Eligibility not restricted by biomarker • No threshold for biomarker determined
Test T vs C restricted to patients with biomarker B > b • Let S(b) be log likelihood ratio statistic • Repeat for all values of b • Let S* = max{S(b)} • Compute null distribution of S* by permuting treatment labels • If the data value of S* is significant at 0.05 level, then claim effectiveness of T for a patient subset • Compute point and bootstrap interval estimates of the threshold b
Generalization of Biomarker Adaptive Threshold Design • Have identified K candidate predictive biomarker classifiers B1 , …, BK thought to be predictive of patients likely to benefit from T relative to C • Eligibility not restricted by candidate classifiers
Test T vs C restricted to patients positive for Bk • Let S(Bk) be log likelihood ratio statistic for treatment effect in patients positive for Bk • Do this for each k=1,…,K • Let S* = max{S(Bk)} , k* = argmax{S(Bk)} • Compute null distribution of S* by permuting treatment labels • If the data value of S* is significant at 0.05 level, then claim effectiveness of T for patients positive for Bk*
Adaptive Signature Design Boris Freidlin and Richard Simon Clinical Cancer Research 11:7872-8, 2005
Adaptive Signature DesignEnd of Trial Analysis • Compare E to C for all patients at significance level 0.04 • If overall H0 is rejected, then claim effectiveness of E for eligible patients • Otherwise
Otherwise: • Using only the first half of patients accrued during the trial, develop a binary classifier that predicts the subset of patients most likely to benefit from the new treatment T compared to control C • Compare T to C for patients accrued in second stage who are predicted responsive to T based on classifier • Perform test at significance level 0.01 • If H0 is rejected, claim effectiveness of T for subset defined by classifier