Download
1 / 85
850 likes | 1.03k Views
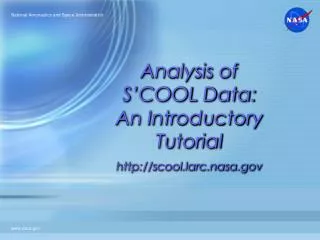
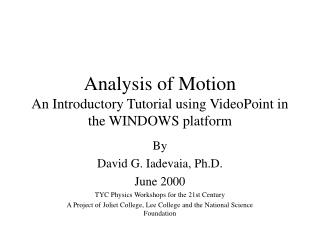
Analysis of Motion An Introductory Tutorial using VideoPoint in the WINDOWS platform. By David G. Iadevaia, Ph.D. June 2000 TYC Physics Workshops for the 21st Century A Project of Joliet College, Lee College and the National Science Foundation. Preface.

E N D
Analysis of MotionAn Introductory Tutorial using VideoPoint in the WINDOWS platform By David G. Iadevaia, Ph.D. June 2000 TYC Physics Workshops for the 21st Century A Project of Joliet College, Lee College and the National Science Foundation
The purpose of this tutorial is help students start using the Videopoint program to collect and analyze data. It was designed for a student who has never used the Videopoint program. By following the step by step format the student will be able to: import a video clip and collect a number of data points from the clip. produce a graph of the data. fit a curve to the data (model). describe the motion from an equation generated by the curve fit. Specific examples were used to analyze an object with a constant velocity and a constant acceleration. The tutorial also contains information on how to edit a video clip using QuickTime Pro. A separate folder is included with several original video clips which can be used for analysis.
A Very Brief Review of Motion According to Galileo
Aristotle’s ideas about motion did not satisfy Galileo’s experimental results. In order to understand and to predict the motion of an object, Galileo abandoned Aristotle’s point of view. Galileo invented the concept of inertia. That is, an object will continue to do whatever it is currently doing.
If the object is moving it will continue to do so. If the object is at rest it will remain at rest. Galileo’s experiments helped him understand the concept of inertia. His experiments helped him formulate his ideas about two important concepts dealing with moving objects.
The concepts are velocity and acceleration. In order to understand these concepts we must understand what it means when an object moves. We will say a change of location of an object defines motion. See the object below New Position
You notice that the object’s position constantly changed as time went by. This is proof that motion has occurred. That which the moving object has is called velocity. Watch again. New Position
If you could mark distance intervals and measure the time it takes for the object to move through the intervals you would then measure its velocity. Equal Time Intervals
If the object moves through a distance in the same time interval for each distance interval then the object has a constant velocity. If we could mark the location of the object in distance and time from a reference then we could easily measure how it moved. Click the mouse to mark the location of the object after each time interval. The object below has a constant velocity. Equal Time Intervals Origin or Reference
If the object moves through larger distances in the same time for each distance then the object has an acceleration. If we could mark the location of the object in distance and time from a reference then we could easily measure how it moved. Click the mouse to mark the location of the object after each time interval. The object below has an acceleration. Equal Time Intervals Origin or Reference
If there was a method of marking the actual video you just viewed it would be possible to take measurements and calculate the velocity of the rolling ball using a computer. There is such a method and it utilizes a powerful video analysis program called Videopoint. We will now use the short video clip and analyze it using Videopoint.
The following sequence will take you through the steps needed to analyze a video clip using Videopoint. 1. Starting the Program 2. Importing a Movie Clip 3. Playing a Movie 4. Collecting data points 5. Scaling the Frame 6. Analyzing the Data
1. Starting the program The Videopoint program is already loaded in the computer. Click the Videopoint icon .
2. Importing a Movie Clip The clip can be previewed here Play the clip using this control bar Select the clip you would like to to import into VideoPoint from the directory containing the clips
Input the number of objects you will study…in this case 1 The movie clip will open and be displayed like this
Main Window Movie Area Coordinate system window Toolbar Table Window
3. Play a Movie Clip This is the movie control bar..use it to play the movie or advance it frame by frame
Click here and the movie plays The object will begin to move
Be sure to have this icon selected before you attempt to take data The cursor is moved over the object and the mouse button is clicked This saves a data point with location and time as the coordinates
Trails Box You can see the data points on the movie area if you select the trails box
5. Scaling the Frame Click on this icon Insert 1 here and Meter here to set the scale of 1 meter It is useful to scale the frames…that is to select an object of known length so the the program “knows” how big a distance interval is
There is meter stick in the frame click on the beginning of the meter stick then…….
Click on the other end….the program now knows how long a meter is in the frame
Graphing the Data Graph icon We can now graph the data select the graph icon from the toolbar
Leave the Vertical Axis as seen Leave the Horizontal Axis as time Position Select position from the pull down menu
Analyzing the Data Select this icon Select linear since you estimate a linear function constant velocity Now you can have the program fit a curve to the plot
Equation Curve A best fit curve is drawn through the points and an equation is displayed
Notice the time interval for 15 frames per second is 0.067 seconds Each frame advances by that amount Here is the data table for the data collected notice that time went ahead but nothing was recorded it wasn’t until the 43 frame that displacement data was collected
By displaying the trails you can easily see that the distance the object travels increases for a fixed time interval……this is proof that the object is accelerating
Select the type of curve…in this case a polynomial It is easily seen that this is not a straight line but a curved line
The formula describing the curve is seen here The curve which fits the data describes a parabola
Several More Advanced Techniques Changing the Origin Editing a Video Clip
The origin of the movie is a fixed point in each frame. That fixed point is the reference for the coordinate system. The origin by default is found at the bottom left of the frame. It remains there for each frame of the clip.