Download
1 / 43
430 likes | 507 Views
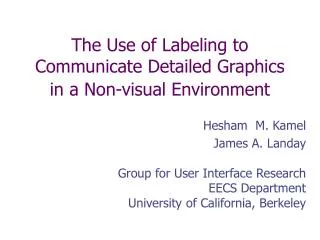
The Integrated Communication 2 Draw (IC2D) Dissertation Talk. Hesham M. Kamel Advisor: Professor James A. Landay Friday May 23rd, 2003. Group for User Interface Research EECS Department University of California, Berkeley. Visual Communication by Blind People. (Kurze, 1996, figure 5).

E N D
The Integrated Communication 2 Draw(IC2D)Dissertation Talk Hesham M. Kamel Advisor: Professor James A. Landay Friday May 23rd, 2003 • Group for User Interface Research • EECS Department • University of California, Berkeley
Visual Communication by Blind People (Kurze, 1996, figure 5)
Overview • Problems with GUIs • Mimicking pencil and paper • IC2D system • Labeling • Animation • Final Evaluation • Conclusion
Problems with GUIs • Rely entirely on visual feedback & direct manipulation • Graphical elements hinder screen readers • Warnings • “…enabling technologies for the sighted have become disabling technologies for the visually-impaired” (Pun, Roth, & Petrucci, 1998) • New interfaces threaten effectiveness of screen readers (Boyd, Boyd, & Vanderheiden, 1990) • Goal of screen reader developers • develop meaningful non-visual representation of picture-based interfaces
Problems with Drawing Tool UIs • Graphical user interfaces • imagine drawing with the monitor off • where is the cursor? • what’s on the screen? • how do I get back to where I was? • Haptic user interfaces • hard to carry • Expensive
Exercise: Can you find my hand? Sculpture inRome, Italy
Sahyun . Sahyun Image Sonification Systems • Auditory graphs (Mansur 1985, Flowers 1993) • Mapping the y axis to pitch and x axis to time • Auditory shape perception (Hollander 1994) • Use of a virtual speaker array to represent shapes • Scene sonification (Meijer 1992) • Pixel-based image-to-sound conversion
Accessing Graphical Data • Relies on the method of output • audio-haptic • Talking Fingertip (Vanderheiden, 1996) • non-speech audio • (Alty & Rigas, 1998) • speech and non-speech audio • Mercator (Mynatt, 1995)
Creating Graphical Data • Relies on the method of input & requires feedback • tactile freehand drawing • Sewell line drawing kit (Millar, 1975) • thermo-pen and heat sensitive paper, speech (Kurze, 1996) • Do tactile freehand drawing tools provide enough feedback?
Study of Blind Drawing Practice • Used the Sewell Raised Line Drawing Kit • 5 participants: 3 partially & 2 totally blind
“The curvature is not what I had in mind. I wanted it to look like a half tear drop.” Testing Curvature and Closure
Importance of Feedback • Improper closure by 3/5 participants • Via touching or looking at the figures participants could assess performance
Testing Length, Angle and Closure Measurement between thumb & pinky Measurement by counting Measurement using knuckles
Self-directed Drawing “It looks a little sloppier than what I had in mind.” “The feet are where they should not be”
Findings of Study • Drawing requires mechanisms for • assessing curvature • finding relative and absolute locations • measuring distances • determining angles • There are a number of strategies for determining line length • 3/5 participants were very happy with their self-directed drawings
1 2 3 4 5 6 7 8 9 Grid-based Drawing Model • Based on telephone keypad • known by most blind individuals • nine fixed screen cells • each cell is a unique point of reference & can be selected • equivalent to point & click • The grid supports • finding relative and absolute locations • measuring distances • determining common angles
IC2D: A Grid-based Drawing Program • For both drawing by the blind & communicating drawings by sighted users • Uses grid for navigation, selection & feedback • Two ways to navigate • directional keys or numbers 1-9 • Voice & non-speech feedback • blind users accustomed to screen readers car created with help of sighted user – self describes its “parts”
Grid Recursion • Allows more precise point selections • Resolution of 27 x 27 cells • permits drawing objects at different scale • Objects drawn at full screen resolution • example, the right arrow
First Pilot Evaluation • Tested with two blind users • both blind from birth • Three drawing tasks after a 25 min. tutorial • Results encouraging • car drawn in ~13 min.
Labeling in IC2D • Allows objects and groups of objects to be annotated • Allows hierarchical labeling structure
Circle Line Line Example of Labeling (Part 1) • Draw a wheel • Consists of a circle and two lines
Example of Labeling (Part 2) • Label tire and spokes Front Tire Spoke1 Spoke2 Circle Circle Line Line Line Line
Front Spokes Group Example of Labeling (Part 3) • Group individual spokes together • Label that group Front Tire Spoke1 Spoke2 Circle Circle Line Line Line Line
Front Spokes Front Wheel Group Group Example of Labeling (Part 4) • Group front tire and front spokes together • Label that group Front Tire Spoke1 Spoke2 Circle Circle Line Line Line Line
Second Pilot Evaluation • 4 participants • 3 blind • 1 partially blind and blindfolded • Task • Say what the picture is • Describe objects in picture
Second Pilot Evaluation Results • Recognition of drawings created by sighted and blind users • Participants successfully described differences • Size, type, direction • Observation • Inability to recognize 3D effect of car
The Impulse for Self-Expression is Unlimited… Lisa Fittipaldi’s Ranjapur (http://lisafittipaldi.com/)
Motivation Behind Creating an Animation Tool for the Blind • Misconception: you can’t carry out a visual task in a non-visual environment • Truth: there can be a bridge between mediums • Animation is a challenge, not a problem • the challenge is to match the physical environment with a proper interface • One goal: allow the manipulation of on-screen objects in a non-visual format
Final Evaluation of IC2D System: Goals • Testing if users could carry out instructed drawing with precision • Testing users’ recognition of interrelational representations of objects • Recognizing objects in relation to grid positions and to each other • Testing labeling as method for understanding drawing via semantic enhancement • Testing if users could draw representations of real-world objects
Methodology • Used standard keyboard input and voice synthesizer output • 16 participants: 8 sighted, 8 visually impaired (5 partially sighted, 3 congenitally blind), 19-49 years old • sighted and partially sighted participants wore blindfolds • Equal amount of familiarization time • Task performance verbalized • Results evaluated on • task completion time • participants’ self-assessed confidence level (1-10, 1 low) • quality of the drawing
Task 1 Part A • Draw three circles, describe spatial arrangement Three circles drawn and described by a congenitally blind participant. • 38-year-old congenitally blind participant: “I can understand the grid concept abstractly, but not in a visual sense, because I have never been able to see.” - 21-year-old sighted participant: “I can almost visualize everything on the screen without having to look at it.”
Task 1 Part B • Draw triangle at smallest grid level in bottom right cell, draw rectangle in top left cell, then connect with line
Task 2 • Explore and describe three labeled drawings • Three different arrangements of a man, tree, and house • One visually impaired participant: “I liked when it told you what the picture was, and where it was. It was very easy to picture that in my mind.” As the participants navigated the cursor around this figure, they heard “top of tree”, “bottom of tree”, “my man”, etc.
Task 3 • Draw a representation of a physical cube a) b) a) A blindfolded partially sighted participant successfully represented a physical cube by counting grid positions. (t=10 minutes)b) A blindfolded sighted participant drew this representation of the cube by visualizing it. (t=9 minutes)
Time for Task Completion (in minutes) • Tasks 1a, 1b, and 3: no significant differences in time, user confidence, or the judge’s rating (Mann-Whitney ranked-sums) • Task 2: visually impaired group significantly faster, more confident, and rated higher
Self-Assessed Confidence Rating • Blind participants more acclimated to output via voice synthesizer • Sighted participants found the experience “intense” • One blind participant: “…the way this grid is laid out is not complicated, you will be able to know exactly where you are all the time.”
Performance Rating (by independent sighted judge) • Visually impaired participants on average performed at least as well as sighted participants • Grid-based model is a useful schema for creating graphics in a non-visual environment
Success of IC2D • A comparison of manual drawing versus IC2D (ASSETS 2000) • IC2D provides proper support for drawing in a non-visual environment a) Drawing using a stylus & pressure-sensitive plastic sheet (ASSETS 2000, Figure 6) b) Drawing by same partially sighted participant using IC2D
Merits of IC2D • Audio feedback can work for drawing • Grid-based model allows • finding relative and absolute locations • measuring distances • determining angles • currently limited for assessing curvature • The recursive grid is a general technique for graphical interaction • The keyboard is an effective navigational device for interacting with graphics
Conclusions • Designed IC2D interface to match users’ limitations and capabilities • Grid-based model provides adequate technological support for developing meaningful drawings • Auditory interpretation of graphics effective interface technique for visually impaired users • Labeling technique effective for users building mental models of visual information • IC2D can be used to increase graphical collaboration and communication between sighted and blind • Creating and accessing graphics in a non-visual environment is not a barrier, it is a challenge
Acknowledgements • James Landay • My Dissertation Committee • My Officemates • EECS Department • Everyone Else
For More Information Hesham Kamel: http://www.cs.berkeley.edu/~hesham http://guir.berkeley.edu/ic2d