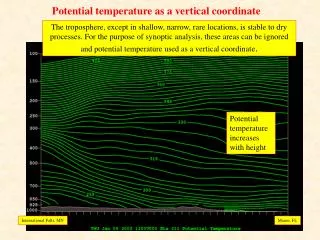
Ocean Water Mass Depth Analysis 1992-2002: Salinity, Temperature, and Carbonate Trends
Explore the depth variations of ocean water masses (1992-2002) affecting salinity, temperature, and carbonate levels. Understand the relationships between water mass depth, salinity, potential temperature, and total carbonate. Dive into the depth analysis from 1992 to 2002 to uncover trends and insights.

Ocean Water Mass Depth Analysis 1992-2002: Salinity, Temperature, and Carbonate Trends
E N D
Presentation Transcript
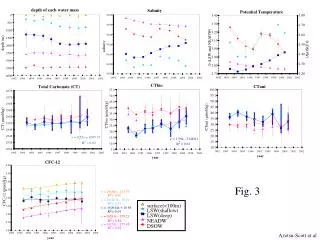
depth of each water mass 1992 1993 1994 1995 1996 1997 1998 1999 2000 2001 2002 0 3.40 1.80 500 3.30 1.70 1000 3.20 1.60 1500 3.10 depth (m) 1.50 2000 3.00 2500 1.40 2.90 3000 1.30 2.80 3500 2.70 1.20 LSW(deep) 4000 CTbio CTant 60.0 55.0 55.0 50.0 50.0 45.0 45.0 40.0 surface(<100m) 40.0 35.0 CTbio (µmol/kg) 35.0 30.0 30.0 25.0 25.0 20.0 y = 0.53x + 1095.73 20.0 15.0 y = 1.59x - 3148.61 2 2 R = 0.62 = 0.63 R 15.0 10.0 10.0 5.0 1992 1993 1994 1995 1996 1997 1998 1999 2000 2001 2002 1992 1993 1994 1995 1996 1997 1998 1999 2000 2001 2002 year 2 R = 0.90 2 R = 0.31 2 R = 0.01 2 R = 0.81 2 R = 0.98 1992 1993 1994 1995 1996 1997 1998 1999 2000 2001 2002 Salinity Potential Temperature 34.92 34.90 34.88 (LSW and NEADW) 34.86 salinity (DSOW) 34.84 34.82 34.80 1992 1993 1994 1995 1996 1997 1998 1999 2000 2001 2002 1992 1993 1994 1995 1996 1997 1998 1999 2000 2001 2002 Total Carbonate (CT) 2175 2170 2165 2160 CTant (µmol/kg) 2155 CT (µmol/kg) 2150 2145 2140 2135 2130 1992 1993 1994 1995 1996 1997 1998 1999 2000 2001 2002 year CFC-12 4.00 3.50 3.00 Fig. 3 2.50 CFC-12 (pmol/kg) y = 0.058x - 113.39 2.00 y = 0.0407x - 79.01 1.50 y = -0.0044x + 10.65 LSW(shallow) 1.00 y = 0.091x - 179.21 NEADW 0.50 y = 0.079x - 157.48 DSOW 0.00 Azetsu-Scott et al year