Precipitation
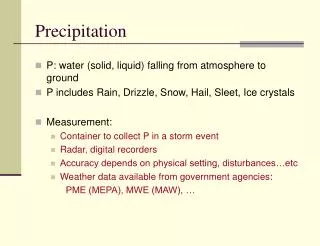
Precipitation. Joan Wu and Jan Boll (06/2012). What Have You Known?. The importance of understanding precipitation as a hydrologic processes Mechanisms by which precipitation is generated Uplift due to convergence Uplift due to convection Uplift due to orography

Precipitation
E N D
Presentation Transcript
Precipitation Joan Wu and Jan Boll (06/2012)
What Have You Known? • The importance of understanding precipitation as a hydrologic processes • Mechanisms by which precipitation is generated • Uplift due to convergence • Uplift due to convection • Uplift due to orography • Sources of precipitation data (NOAA-NCDC) • Basic DDF or IDF analysis • DDF: depth-duration-frequency • IDF: intensity-duration-frequency
What Are Covered Here? • Critical temperatures for rain-snow transition • Point measurements of precipitation • Filling in missing data • Precipitation data generation using PRISM • Precipitation data generation using CLIGEN
Critical Temperatures forrain-snow transition • If a precipitation record does not specify the form of precipitation, what do we do? • How do we decide whether precipitation was rain, snow, or a mixture of rain-snow?
Probability of occurrence of rain or snow as a function of air temperature (Auer, 1974)
Partition of Precipitation (P)into Rain or Snow • Ps = PTa <= Tmin • Ps = (Tmax−Ta)/(Tmax−Tmin) PTmin < Ta < Tmax • Ps = 0 Ta >= Tmax • Pr = P−Ps • Pr, Ps = water equivalent depths of rain and snow, respectively, • Tmin = threshold temperature below which all precipitation is snow • Tmax = threshold temperature above which all precipitation is rain • Between the threshold values precipitation is a mix of rain and snow • Typical threshold temperatures are −1.1C and 3.3C
Point Measurements • Questions on gage setup and influence on measurement accuracy • What size orifice should be used? • How should the plane of the orifice be oriented? • How much should the gauge protrude above ground surface? • Should the gauge be installed with a device to reduce wind effects, e.g., with a wind shield? • How far should the gauge be from other projections (trees, buildings)? • How can we prevent water from splashing out? • How can we prevent evaporation of the collected water?
(a) Without wind shielding; (b) rigid Nipher-type shields; (c) hinged Alter- type shields (Dingman, 2002)
Ideal rain gage for rainfall with egg-crate Structure (Dingman, 2002)
Point Measurements • Other errors? • Instrument error • Observer error • Errors due to different observation times • Error due to occult precipitation • Errors due to low-intensity rains
Point Measurements • Checking the consistency of point measurements • Change of gauge location • Change of gauge type • Change of gauge environment • Change of gauge observer • Change of gauge climate • Double-mass curve technique
Double-Mass Curve Technique • A plot on regular arithmetic graph paper • Successive cumulative annual P at the gauge in question vs the cumulative avg. annual P at nearby gauges for the same period • A break in slope indicating inconsistence • Adjustment maybe needed if the break in slope persists over 5 yr
Double-Mass Curve Technique • If a, b are slopes of lines after and before the break, respectively: • Adjustments to previous events by multiplying each of them by a/b, or • Adjustments to recent events by multiplying each of them by b/a
Filling in Missing Data • Station-average method • Normal-ratio method • Inverse-distance weighting • Regression
Station-Average Method • PX is the missing precipitation value for station X • P1, P2, …, Pn are precipitation values at the adjacent stations for the same period • n is the number of nearby stations
or Normal-Ratio Method • PX is the missing precipitation value for station X for a certain time period • P1, P2, …, Pn are precipitation values at adjacent stations for the same period • NX is the long-term, annual average precipitation at station X • N1, N2, …, Nn is the long-term precipitation for neighboring stations • n is the number of adjacent stations
2. 3. • PX is the missing precipitation value for station X for a certain time period • Pi are precipitation values at adjacent stations for the same period • n is the number of neighboring stations Inverse-Distance Weighting 1. di = (xi2 + yi2)0.5 • Distance from gage with missing data to the neighboring gages • Weight of distances where b is a proportionality factor (b = 1, 2 )
Regression • PX is the missing precipitation value for station X for certain time period • P1, P2, …, Pnare precipitation values at the neighboring stations for the same period • b0, …, bn are coefficients calculated by least-squares methods • n is the number of nearby gages • Method suitable when there is a large number of days when observations are available for all gages PX = bo + b1P1 + b2P2 + …. + bnPn
http://www.wcc.nrcs.usda.gov/ Click Products on top bar and choose Climate
http://forest.moscowfsl.wsu.edu Click Modeling Software/Erosion Modeling/ FS WEPP