Download
1 / 18
190 likes | 377 Views
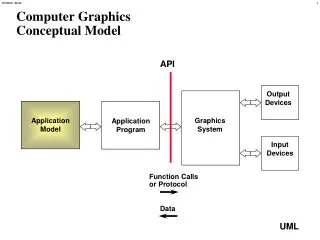
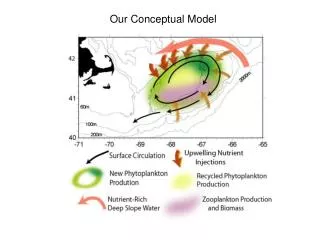
Our Conceptual Model. Seasonal cycle of nutrients and temperature on the crest of Georges Bank. Nutrient Recharge is Across the Flanks… in Fall, not Winter. Pastuzak et al., 1982. The “Donut” Hypothesis of Post-Bloom Nutrient Injections & Production. Presumed Greater Production on NE Peak….

E N D
Seasonal cycle of nutrients and temperature on the crest of Georges Bank Nutrient Recharge is Across the Flanks… in Fall, not Winter Pastuzak et al., 1982
The “Donut” Hypothesis of Post-Bloom Nutrient Injections & Production
Sources of, and what happens to, dissolved inorganic nutrients that are brought onto Georges Bank
Biological Model (Rubao Ji, UMass Dartmouth) Nitrate Silicate Ammonia Uptaking Uptaking Uptaking Remineralization Dissolution Small Large Phytoplankton Phytoplankton Grazing Grazing Mortality Mortality Small Large Predation Zooplankton Zooplankton Mortality Mortality Fecal Grazing Mortality Detritus Detritus Nitrogen Silica
Proposed Modeling Experiments: Seasonal Cycle and Transects…
Another Interesting Angle… Divergent Upwelling on NE & SW Portions?
1999 Surface Chlorophyll All Data 1997 1998 Jan Feb Evidence of NE & SW Patches? Mar What about interannual variability in timing of the spring bloom? Apr May Jun
1998 1999 Jan Available SeaWiFS Images: Monthly Composites Feb Mar False Start in 1998 Earlier Start in 1999… Apr Chl a ug/L May Jun
EL9905 SB911 CTD Casts (n=89) Calm sunny days led to atypical structure (shallow thermocline) during part of the frontal study Delta t /m front Depth (m) Station Depth (m) Shelf regions were therefore defined by T ( ºC) from 5 m to bottom: <1 = crest; 1-2 = front; >2 = strat.
Mixed (n= 3 profiles) Front (n=8) Stratified (n=17) Copepodites Nauplii Depth (m) Mean No. m-3 x 10⁴
Taxonomic Composition Front (n=8) Mixed (n= 3 profiles) Stratified (n=17) n = 14,254 identifications, 249 samples, 29 profiles; variances available but not plotted
Size Bins Used for Copepod Lengths Length (mm) Size Category
Particle size spectrum and abundance at two depth intervals Stratified (n=17) Front (n=8) Mixed (n= 3 profiles) Mean No. m-3 x 10³ at 15 – 20 m depth Mean No. m-3 x 10³ at 25 – 30 m depth
Mixed (n= 3 profiles) Front (n=8) Stratified (n=17) Copepodites Nauplii Depth (m) Mean No. m-3 x 10⁴
Crest Front Depth (m) Middle Shelf Proportion Larval cod from 1 m MOC, May 1999, Greg Lough Size (mm) No. m-2