T- PARC (Summer Phase)
This document outlines the objectives and methodologies of the T-PARC Summer Phase project, which aimed to improve 1-3 day forecasts of tropical cyclones. Targeted observations were identified in sensitive regions, with case selection made 2-3 days prior to observation. Verification was conducted across Guam, Taiwan, and Japan. Results from several experiments indicate significant improvements in forecast accuracy, particularly through the use of aircraft dropwindsondes and enhanced satellite data. Insights include the varying impacts of observations depending on model systems and assimilation methods.

T- PARC (Summer Phase)
E N D
Presentation Transcript
T-PARC (Summer Phase) Sharanya J. Majumdar (RSMAS/U. Miami) Christopher S. Velden (CIMSS / U. Wisconsin) Section 4.7, THORPEX/DAOS WG Fourth Meeting 27-28 June 2011.
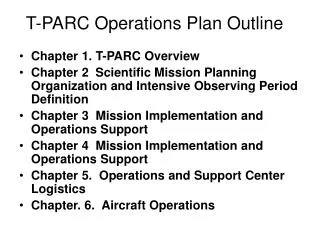
Objective: To improve 1-3 day forecasts by obtaining targeted observations in regions with high sensitivity. • During the field phase, a team identified potential opportunities to collect targeted observations: • Cases selected 2-3 days prior to observation time. • Common verification regions, Guam, Taiwan, and Japan • Individually selected verification regions: calculations performed through ECMWF/Met Office PREVIEW DTS • Final flight paths chosen one day prior, based on targeted observation guidance and team consensus. • Post field phase: Data denial experiments; observation impact experiments; different events considered.
MWR Special Collection http://journals.ametsoc.org/page/Cyclone_Predictability IWTC-VII, La Réunion, France 15-20 November 2010 Special Focus 1a: Targeted observations for TC track forecasting. C.-C. Wu and Sharan Majumdar
Outline • Tropical Cyclone Track • Aircraft: Dropwindsonde and Wind Lidar data • Satellite: AMVs and radiances • Other forecasts • Mid-latitudes • Downstream impacts
Tropical Cyclone Track DLR Falcon 20 US Air Force WC-130 US NRL P-3 DOTSTAR Astra jet F. Harnisch
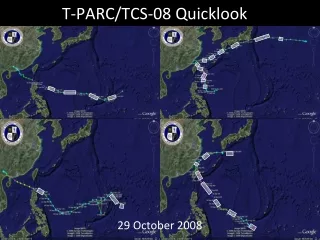
Period: 2008090900-2008091812 and 2008092412-2008092900 M. Weissmann
Harnisch and Weissmann (MWR 2010) • Separation of dropwindsonde observations into 3 subsets: →typhoon vicinity: largest improvements of ECMWF track →remote sensitive regions: small positive to neutral influence →typhoon center and core: overall neutral influence • Weissmann et al. (MWR 2011) • NCEP and WRF/3dVar: Improvementfrom20-40% • Comparablylowinfluencein ECMWF and JMA. • Lowerforecasterrorswithoutdropsondes in ECMWF & JMA • Moreextensive use of satellitedata and 4d-Var? • Chou et al. (MWR 2011) Mean 1–5 day NCEP track forecast error is reduced by 10–20% for DOTSTAR and T-PARC cases (not as beneficial in ECMWF) • The different behaviour of the models emphasizes that the benefit depends strongly on the quality of the first-guess field and the assimilation system
YH Kim et al. (APJAS, 2010): 17-22% improvement to short-range track forecasts. Mid-tropospheric data most effective (WRF/3dVar). • Jung et al. (APJAS, 2010): observations over ocean more important than over land. Dropwindsondes most important at times they were launched. Otherwise, QuikSCAT and SATEM data were most important. Observations in sensitive areas improved the forecast (WRF/3dVar). • HM Kim et al. (2011): Positive impact ofdropwindsondes can be found in ensemble forecasts (WRF/EnKF). • NOTE: Radiances not assimilated in these studies
Sinlaku Airborne Doppler Wind Lidar IR Satellite Image 09/11/08 1830 LT 16W Okinawa Tokyo M. Weissmann
Weissmann et al. (QJRMS, in review) • 2500 high-density, high-accuracy wind profiles measured from DLR Falcon during Typhoon Sinlaku. • Data denial • ECMWF track forecasts improved by ~50 km for 1-5 days. • NOGAPS track forecasts did not improve (due to bogus?) • Improvement in 500 hPa and 1000 hPa Z. • Adjoint method • Total relative DWL contribution 2x as large in NOGAPS as ECMWF. • Impact per ob is comparable to other platforms (higher in NOGAPS) • Atmospherics Dynamics Mission Aeolus (ADM-Aeolus)lidar instrument planned for launch by ESA (2013?)
Improved targeting methods for TCs Var-ETKF Moist Adjoint Doyle et al. (2011, CISE) Majumdar et al. (2011, QJRMS) Ensemble sensitivity MesoscaleSVs Kim et al. (2011, WAF, in press) Mahajan and Hakim (2011)
Hourly AMVs: reduce mean 3-5 day track forecast errors by 6-10% Rapid-scan: further reduces the 3-5 day NOGAPS track forecast errors
Assimilation of AMVs on the mesoscale • Framework: NCAR Data Assimilation Research Testbed (DART) • Data assimilation: Ensemble Kalman Filter (EnKF) • Model: Advanced Research WRF (WRF-ARW) • Ensemble members: 32; Case: Typhoon Sinlaku (2008) • Assimilation cycle started Sep. 1st, 2008. (one week before genesis) • 9km moving nest grid with feedback to 27km grid in the forecasts when TC is present. • Deterministic: ECMWF 1.125°x1.125° (Baseline) CIMSS: Cooperative Institute for Meteorological Satellite Studies ; JMA: Japan Meteorological Agency
Analysis Track and Intensity CIMSS JMA Best Track CIMSS Structure CIMSS CTL 09/09:00Z CTL 09/10:00Z CIMSS Upper-lev Div (left) Azi-mean Vort (Right) 09/11:00Z
Analysis increment – Theta Prior Post
Targeting Typhoon season with extra-satellite data • Selective data thinning experiments • Cntrl : 1.25o Global • SV-Sat: 1.25o Global and 0.625o in SV areas. • Drop : 1.25o Global +Targeted Dropsondes • SV-Sat-Drop: Targeted Dropsondes+ SV areas 0.625o • Additional information • All experiments are run at T799TL95/159/255 L91 (12-hour 4D-Var) • 06-30 September 2008 • Verification and SV-target region 10-50N, 110-180E • 20 Leading T95L62 SV • SVs area cover 20% of the target region C. Cardinali
09 + 10 11 Sept Drop SV -Sat cntr cntrl SV-Sat + Drop cntrl Sinlaku 09-19 September: mean track error km C. Cardinali
Forecast Sensitivity to Obs: SV-Sat+Drop Forecast error and Verifying analysis • Extra-satellite data gave a more consistent impact due to homogeneous coverage and data diversity (moist, temperature, cloud, precipitation and surface wind) C. Cardinali
Influence on ECMWF midlatitudeforecasts deterioration improvement only 2 Sinlaku flights improvedtrackforecast --> improvedfirst-guessforsubsequentdays --> improvedmid-latitudeforecast overall neutral influence of observationsduring ET, althoughthesewerepartlyguidedby SV calculationsoptimizedforthe Pacific M. Weissmann
Downstream Impacts • Aberson (MWR 2011, in press) • Dropwindsondedata provide global improvements to NCEP GFS TC track forecasts of about 10% through 72 h, but decreasing at longer forecast lead times.
T-PARC Accomplishments • Demonstrated utility of coordinated aircraft missions, and dropwindsonde and DWL data • Benefits of higher spatial and temporal density of satellite winds and radiances • Improvements to forecasts downstream, although targeting strategy not essential here • Accelerated use of TIGGE: full fields and CXML database • Large number of peer-reviewed publications
Recommendations (from IWTC-VII) • Aircraft observations are limited (particularly in NW Pacific): make improved use of existing observations. Satellite radiance data, andAMVs. Special rawinsonde launches? • Given that observations / models / DA evolve, need to frequently review targeted observing programs. • Explore new strategies, in basic research, OSEs and OSSEs. • Consider new observing platforms e.g. UAS, wind lidars. • Coordinate use of observations (e.g. EURORISK PREVIEW) • Explore tropical cyclone formation, structure and intensity.