Download
1 / 20
200 likes | 350 Views
Statistical analysis and modeling of neural data Lecture 6. Bijan Pesaran 24 Sept, 2007. Goals. Recap last lecture – review time domain point process measures of association Spectral analysis for point processes Examples for illustration. Questions.

E N D
Statistical analysis and modeling of neural dataLecture 6 Bijan Pesaran 24 Sept, 2007
Goals • Recap last lecture – review time domain point process measures of association • Spectral analysis for point processes • Examples for illustration
Questions • Is association result of direct connection or common input? • Is strength of association dependent on other inputs?
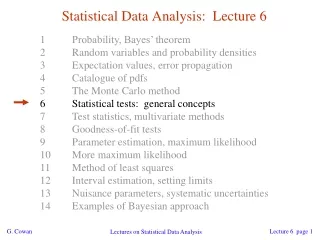
Measures of association • Conditional probability • Auto-correlation and cross correlation • Spectrum and coherency • Joint peri-stimulus time histogram
Limitations of correlation • It is dimensional so its value depends on the units of measurement, number of events, binning. • It is not bounded, so no value indicates perfect linear relationship. • Statistical analysis assumes independent bins
Scaled correlation • This has no formal statistical interpretation!
Corrections to simple correlation • Covariations from response dynamics • Covariations from response latency • Covariations from response amplitude
Response dynamics • Shuffle corrected or shift predictor
Non-stationarity • Assume moments of the distribution constant over time. • Simplest solution is to assume stationarity is local in time • Moving window analysis
Spectral analysis for point processes • Regression for temporal sequences • Naturally leads to measures of correlation • Statistical properties of estimators well-behaved
Spectral examples • Refractoriness – Underdispersion • Fourier transform of Gaussian variable • Bursting – Overdispersion • Cosine function
Substitute into loss: Minimize wrt B(f): Minimum value is: Where: