Webinar : PowerPoint Interactions For Operations
380 likes | 396 Views
Anand S, Gramener's CEO and Co-Founder conducted an interesting webinar on how to engage your audiences for interactive PowerPoint decks.<br><br>This webinar will teach you how to use tools and strategies to build engaging interactive presentations that illustrate WHERE problems are and WHY they exist. <br><br>You will be able to make such presentations and use examples to guide your team.<br><br>Watch full webinar on: https://info.gramener.com/interactive-powerpoint-for-operations<br><br>Contact Us & Book a free demo: https://gramener.com/demorequest/

Webinar : PowerPoint Interactions For Operations
E N D
Presentation Transcript
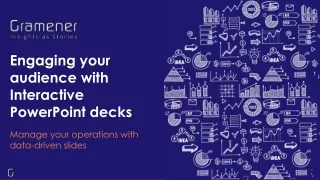
👍👎 Engaging your audience with Interactive PowerPoint decks Manage your operations with data-driven slides
In an era of Business Intelligence, why are we talking about PowerPoint? Despite “self-service BI”, creating a dashboard in Tableau, Power BI, Qlik, Spotfire, Microstrategy, etc requires specialized expertise. But your secretary can create a PowerPoint presentation. Today, the standard process today is to take screenshots from Excel, BI dashboards, etc, stitch them into a story, and share them with users. This is the most common workflow in the world to share insights from data. Users can access the content offline, store it anywhere, forward it to anyone – even people who don’t have access to BI dashboards. The very things that IT departments fear – but users find convenient. For the author, it’s easier to design the story flow and visualization. Using shapes, images, and past slides, authors can quickly design content. Just as Excel was never replaced, PowerPoint won’t be replaced either. PowerPoint is actually the #1 data visualization platform in the world
Today is not about WHAT story to tell. It’s about HOW to tell it engagingly We won’t cover this Creating effective PowerPoint presentations and narrating interesting data stories are great topics. That’s not what this session is about. It’s not about storytelling, slide design, picking colors, picking charts, visualizations, maps, or presentation skills. (Gramener runs a data storytelling workshop that covers these. I’ll mention that at the end.) We will cover this Today is about one specific technique in PowerPoint: Interactive data-driven presentations. We’ll focus more on examples that people on operations (sales, marketing, manufacturing, finance, HR, IT – any kind of operations) will find useful. We’ll start with techniques. We’ll move on to use cases. I’ll share 3 simple tips to learn more. Listen on. You may discover something new.
PowerPoint has five interaction capabilities Link Morph Plugin Animate Zoom Let’s learn what these are No, let’s jump to the use cases
Link to any slide when you click on a shape Interactions Click here to go to the first slide Click here to go to the last slide You can jump to any slide (e.g. the 3rd slide) You can use any shape Click here to go to the previous slide Click here to go to the next slide You can link images You can link to websites This is the most common interaction in PowerPoint
Link the blue circle to the 3rd slide,and the orange circle to Gramener.com 3rd slide Gramener PracticeLet’s create a link
Animate shapes within a slide: show, hide or move Interactions This shape will disappear on click This shape will appear on click Click shape to spin the picture below Click shape to toggle picture below This shape will move to the right This is the 2nd most common interaction in PowerPoint
Create an animation that moves this rectangle down when the circle is clicked. PracticeLet’s animate
Morph shapes smoothly from one slide to the next Interactions Team performance Each of these shapes shows a team’s performance. They are sorted in alphabetical order. Team A Team B Team C Team D
Morph shapes smoothly from one slide to the next Interactions Reference Team performance Now they are sorted in performance order. By smoothly animating, we can see the change in context. Supported versions Team B PowerPoint for Office 365 PowerPoint for Office 365 for Mac PowerPoint for the web PowerPoint 2019 PowerPoint 2019 for Mac PowerPoint for iPad PowerPoint for iPhone PowerPoint for Android tablets PowerPoint for Android phones PowerPoint Mobile Less Team A Team D Team C You can morph shapes, text, pictures, even SmartArt
Create a copy of this slide. Smoothly move these shapes below to different positions. PracticeLet’s morph
Zoom into any slide when you click on a shape Interactions Reference Section Zoom Slide Zoom Instructions You can zoom into one or more sections. These icons are live summaries of those slides. You can zoom into any slide, just like links. These icons are live summaries of those slides. Go to Insert > Zoom. Select one of the Zoom options. Zoom is available in Office 365 & PowerPoint 2019
Add 2 Slide Zooms into any 2 slides PracticeLet’s add a zoom
Plugins can add more interaction capabilities Interactions
What can Dee, an Operations Manager, use these for? We’ll explore actual uses of interactive presentations Time check: 15 minutes
Table of Contents lets users jump to relevant sections Gramener uses Links to create a table of contents for its 720-slide library of slides. This first page shows the document structure. Each box links to the relevant section. Some sections have case studies marked using a ▼ symbol. Clicking on the symbol directly jumps to the case study. Note: The actual links on this slide were deleted when anonymizing. The design was preserved. About Products Offerings Gramener Introduction Gramex ▼ Smart Alerts Analytics ▼ AI / ML ▼ Partnerships ▼ Autolysis Data Explorer ▼ Design ▼ Visualization ▼ Cluster ▼ Narratives ▼ Cleansing Consulting Case Studies Financial Services Media Public Sector Retail & Consumer Healthcare Manufacturing Agriculture Telecom Sports Education Society Just Fun Finance HR IT & SM Marketing Administration This is a consolidation of all final Gramener slides. View in slideshow mode. Click on any link in slide-show mode to open the page. (Ctrl-Click in normal mode.) Dee can visually show the document structure using links
Maps & Layouts can be used as a way of navigation The document or section structure doesn’t need to be textual. It can be a map or a layout. Click on a colored state for more details about that state. Colors add information (e.g. how the state is performing). Layouts of plants, offices, stores, data centers, etc can be used as layouts. Note: PowerPoint can import SVG files and ungroup them into native PowerPoint shapes. Dee can use layouts to visually drill down into the deck
Quizzes help users learn by taking a point of view and changing it Download this A client once asked me: “How do you handle an audience that always says ‘I knew that already’?” I said, “I ask them beforehand: ‘What do you think the answer is?’” Pre-quizzes are a great way of priming learning. It nudges people into opinions, and change it in the face of data. Post-quizzes are a great way of validating learning. It helps people reinforce what they learned. Quizzes are fun & engaging, in general. Dee can create quizzes to improve learning & engagement
Progressive reveals build up charts and slides Recovery times are neutral during the evening and morning shifts (mornings are slightly worse), night times are the best. Complex content is confusing at first. By building up the content step-by-step, you can help the presenters show only what’s required, and move on when the audience has understood. For example, in charts, start with the axes, then elements, then the rest. For complex charts, explain parts of the chart one by one. Shift Evening Morning Night Specifically, Friday mornings are particularly bad. So are Thursday mornings. Recovery times are worst on Fridays, and best on Saturdays & Wednesdays. Weekday Fri Mon Sat Sun Thu Tue Wed However, RPP on Sundays is unusually slow. The FAH product category has the best recovery time, while ZDH is much worse. Product category FAH N70 RPP TDS ZDH This is especially problematic for ZDH Part shipped products tend to perform worse than full-shipments. Specifically the <20% and 40-60% part-shipments. Part shipment 20-40% 40-60% 60-80% <20% Full Dee can narrate data stories progressively, step-by-step
Doodling animations are now part of PowerPoint’s capabilities Reference The Office “Draw” feature now has a new animation option called “Ink Replay”. This lets you draw by hand, and then animate it, to create a hand-drawn effect. This is a very engaging form of animation that requires nothing more than PowerPoint, and perhaps a touch screen or tablet. Dee can make text, pictures & charts far more eye-catching
Morphs show change will retaining context in the story Let’s say we want to explain the how each of the Western states is performing and show it in the context of the map. It’s unlikely that users will remember the shape of the state – e.g. that this state is Utah.
Morphs show change will retaining context in the story Let’s say we want to explain the how each of the Western states is performing and show it in the context of the map. It’s unlikely that users will remember the shape of the state – e.g. that this state is Utah. But if we smoothly morph the shapes, retaining the context, this becomes much easier. Dee can help users see change while retaining context
Morphs can even rotate 3D objects This airline maker wants to explain to their client what the impact of heavy particle damage on the left wing of this aircraft. Typically, these are represented as images with annotations. Left wing faced heavy particle damage during the flight
Morphs can even rotate 3D objects This airline maker wants to explain to their client what the impact of heavy particle damage on the left wing of this aircraft. Typically, these are represented as images with annotations. But with the emergence of 3D models and PowerPoint’s ability to morph them, we can retain context and explain with more clarity. This increased the erosion under the left wing, leading to higher resistance. Dee can explain events from multiple perspectives
Bar chart races show how things have improved or worsened with time Bar chart races are a recent, very popular, and highly engaging form of animated visuals. This can be used to show the top performing customers, regions, plants, business units, or any other entity – and their performance across time. Who is beating whom, who’s entered the league tables, and who’s been bested by who – these are questions a bar chart race answers very clearly. These can be created with PowerPoint morph transitions. Download this Dee can show who’s knocking whom out in the top 10 race
Sand dance shows how people, clients & resources are distributed Sand dances are another recent, popular, and engaging animated visual form. Each icon represents one unit – person, client, project, equipment, etc. They are grouped together in a certain way but can be re-grouped in other ways. As they are re-grouped, each unit moves into the new group. Audience sees what’s going where visually. These can be created with PowerPoint morph transitions. Offering Type Deal Stages Business Unit Geographic Distribution Industry UnitedStates Australia India China 8 60 36 11 Dee can use sand dance to explain data distribution
Sand dance shows how people, clients & resources are distributed Sand dances are another recent, popular, and engaging animated visual form. Each icon represents one unit – person, client, project, equipment, etc. They are grouped together in a certain way but can be re-grouped in other ways. As they are re-grouped, each unit moves into the new group. Audience sees what’s going where visually. These can be created with PowerPoint morph transitions. Offering Type Deal Stages Business Unit Geographic Distribution Industry Switching Performance Optimization Routing Vendor Technical Services Resale ELA Site Survey Network Security Staffing Solution Dee can use sand dance to explain data distribution
Sand dance shows how people, clients & resources are distributed Sand dances are another recent, popular, and engaging animated visual form. Each icon represents one unit – person, client, project, equipment, etc. They are grouped together in a certain way but can be re-grouped in other ways. As they are re-grouped, each unit moves into the new group. Audience sees what’s going where visually. These can be created with PowerPoint morph transitions. Offering Type Deal Stages Business Unit Geographic Distribution Industry Manufacturing Retail & Wholesale Automotive Financial Services Dee can use sand dance to explain data distribution
Drilldown Sunbursts compare performance across segments The Sales Operations team of a consumer goods company needed an interactive presentation to run their board discussion. The Head of Sales usually presented the performance across channels. But the discussion rarely went in the way it was scripted. To allow the audience to participate in the discussion, this interactive drilldown lets the presenter pick the path they want to go along. Download this Dee can allow presenters to chart their own path
DrilldownTreemaps explain where performance is falling This is a product performance scatter plot. Each circle is a product. The X-axis is the market share. The Y-axis is the growth rate. The size of the circle represents sales. Click on the circle to expand it and see the performance of the underlying countries in Asia. Download this Dee can let users pick areas they want to explore
Drilldown Flows explain why performance is falling This is a product performance scatter plot. Each circle is a product. The X-axis is the market share. The Y-axis is the growth rate. The size of the circle represents sales. Click on the circle to expand it and see the performance of the underlying countries in Asia. Download this Dee can guide users to find reasons on their own
Drilldown Motion Charts explain how sub-groups are performing -40% -30% -20% -10% 0% 10% 20% 30% 40% Growth Rate +40% This is a product performance scatter plot. Each circle is a product. The X-axis is the market share. The Y-axis is the growth rate. The size of the circle represents sales. Click on the circle to expand it and see the performance of the underlying countries in Asia. HVG Growth: 5% KRD Growth: 8% RPT Growth: 16% VSP Growth: 8% MDC Growth: 10% C&C Growth: 14% B2B Growth: 41% Download this +35% Share Value C&C +30% VSP C&C Share: 29% KRD RPT +25% VSP Share: 26% KRD Share: 23% RPT Share: 23% Market Share: 22% MDC Market Growth: 9.4% +20% HVG MDC Share: 19% HVG Share: 17% +15% +10% Others Dee can allow users to drill into each group’s performance +5% B2B B2B Share: 4% +0%
What can you do next? Time check: 35 minutes
What can you do next Learn Practice Teach PowerPoint has many new features. Go through every item in the PowerPoint ribbon. You’ll find something you didn’t know about before – every time. (I do.) We learn by doing, not by reading or listening. • Try the practices in this deck. Try the new features you learn about. Revise your last PPT and practice it on your next one. We learn the most when we teach. Share what you learn with your friends & teams. Organize sessions, show your work, see their work, and learn together.
How can Gramener help you • Gramener runs “Data Storytelling” workshops • This has a 1-day and a 5-day version that covers • Understanding your audience & intent • Finding insights • Creating the storyline • Visual design, annotations, and more • We run this for corporates and colleges. • If you’re interested, we will contact you with details. • Gramener has a PowerPoint plugin for interaction • It helps create advanced interactive visualizations like • Bar chart races • Sand dance • Motion chart • Drilldown flows, treemaps, sunbursts, and more • We are launching a beta version of this in March 2020. • If you’re interested, we will keep you informed. If you had to pick only one of these, what would you pick?
Thank you Your feedback will help!