1 / 34
340 likes | 361 Views
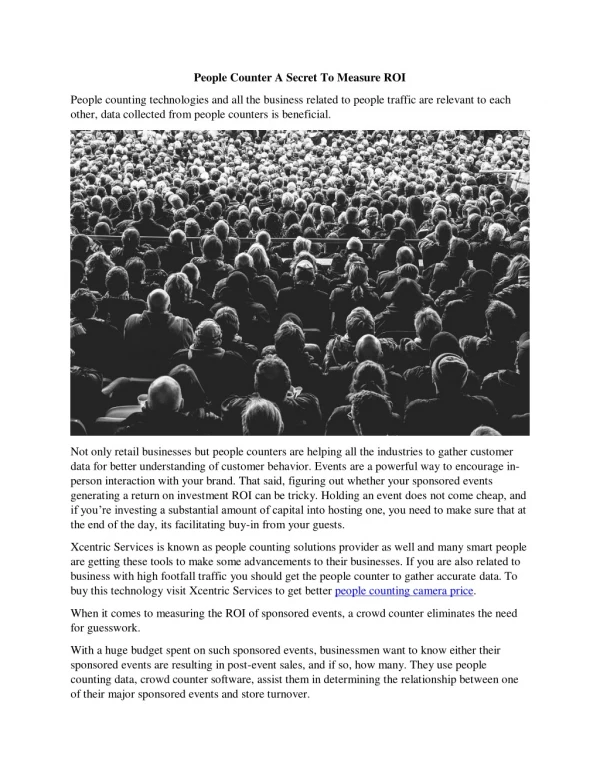
Ganes Kesari, Gramener's Chief Data Scientist, demonstrates how to value your data initiatives using a simple step-by-step method that any business leader can follow.<br><br>Who should watch this webinar:<br>Executives, Chief Data Officers, Technology Leaders, Directors.<br><br>Learnings:<br>-Finding high-impact business use cases<br>-Choosing effective success indicators<br>-Assuring that the outcomes are attributed to your data initiative<br><br>Webinar link:<br>https://info.gramener.com/5-steps-to-measure-roi-on-your-data-science-initiatives<br><br>Know more about data advisory: https://gramener.com/advisory-consulting/

E N D
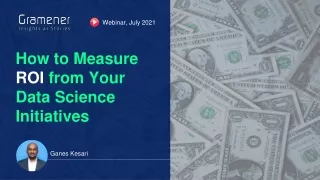
Webinar, July 2021 How to Measure ROI from Your Data Science Initiatives Ganes Kesari
How can you do it right? Why is ROI so difficult? How to compute returns?
Introduction GanesKesari Co-founder & Chief Decision Scientist Help start, apply and adopt Data Science 100+ Clients /gkesari @kesaritweets “Simplify Data Science for all”
State of the Industry: Data & Analytics investments vs returns On average, firms invested over $38 M in data & analytics Over 79% of these firms report negative or no ROI We hear more about the money invested.. ..than about the returns generated Reference: ESIThoughtLabreport – Driving ROI from AI
Reason #1: Data often doesn’t lead to outcomes This chain is very often broken… Insights Data Recommendations Actions Outcomes Data sits idle and untapped The actions don’t connect to a workflow Outcomes often go unmeasured Most dashboards don’t prescribe actions Model stats are a poor cousin of insights “ 80% of projects don’t deliver outcomes in the industry Reference: ESIThoughtLabreport – Driving ROI from AI
Reason #2: The outcomes are often not quantified as benefits Improved branding Higher Efficiency Better decisions “ One measurement is worth a thousand expert opinions. - Grace Hopper
Reason #3: The benefits may not have been caused by your project Disney+ launched in November 2019 had a stretch goal to acquire 90 million subscribers by 2024. It beat this goal in 14 months. Was this due to a brilliant marketing strategy, or was it just a pandemic windfall?
What’s your data really worth? Data has a lot of intrinsic value… …but unless you monetize it directly.. …or indirectly, the value will be wasted
The SMART framework to quantify value from data & analytics initiatives r r r r A S M R T Define Success What are your target outcomes? Measure Value How will you measure your outcomes? Attribute Outcomes What led to the results observed? Reckon Breakeven What are your net costs & benefits? Tally Results What’s your benchmark performance? T A M R S Attribution Tally Measure Success Reckon
Beverage manufacturer uses analytics to optimize plant cost Challenge “Drink It” is a leading global manufacturer of soft drinks. Over the past year, the company has observed a rise in bottling costs across regions. Approach • Statistical diagnostic analytics to identify recommendations for improvement • Command centre with predictive capabilities to run scenario-based simulations
1. Define Success: What are your target outcomes? Pick the right mix of outcome categories… Financial Customer Stakeholder Innovation Organizational
1. Define Success: What are your target outcomes? ..and identify the attributes that your initiative must influence Financial Stakeholder Customer Innovation Stakeholder Customer Organization Finance Innovation Portfolio mix Revenue Employees Customer Exp. Ops. Perf. Organization Innov. culture Margin Investors Business value Brand Equity Cash Flow ESG
DRINK IT: Definition of success outcomes Strategic Objectives Users Outcomes • Optimize the global manufacturing cost • Improve resource and employee utilization • Streamline manufacturing process • Plant managers • Regional Leadership • Financial • Cost saving • Employee • Enablement • Utilization • Organization • Ops. Performance • ESG “Drink it”
2. Measure Value: How will you quantify your outcomes? Financial Stakeholder Customer Organization Finance Innovation Stakeholder Customer Innovation • Revenue growth • Gross margin • Operating expense • Receivables/ payables • New products launched • Revenue from new products • Employee innovation index • Attrition rate • Employee satisfaction • Stock Price • Return on equity • CSAT score, • Customer Lifetime Value • Acquisition Cost • Share of wallet • Time to Market • Process cycle time • Brand Salience • Reduction of carbon footprint Organization
DRINK IT : Measuring the success metrics through FISCO Success metrics Outcome Categories Success attributes • Manufacturing cost per case • Production line cost per plant Finance Cost saving “Drink it” • People empowerment • Employee productivity Enablement Employee Utilization • Manufacturing process cycle time • Asset utilization • Reduction of carbon footprint Ops. Perf. Organization ESG
3. Attribute Outcomes: What led to the results observed? Outcomes Identify all factors that could influence your target outcomes Causal factor 2 Causal factor 1 Causal factor 3 Causal factor 4
3. Attribute Outcomes: What led to the results observed? DoWhy Causal Testing A/B Testing A B 10% attrition 7% attrition Reference: Microsoft GitHub report – DoWhy | An end-to-end library for causal inference
DRINK IT: Causal diagram representation Market factors Manufacturing process Seasonality Process efficiency Demand Manufacturing plant cost “Drink it” Competitors Command Tower insights Transportation cost Staffing levels Material cost Employee productivity Labour cost A/B Testing helped isolate benefits delivered by analytics Material cost Employee efficiency
4. Reckon Breakeven: What are your net costs and benefits? Balance your qualitative benefits with quantitative measures • Revenue, • Margin, • Cash flow • Building capabilities (Software & Hardware) • Effort • Time • Opportunity cost Cost Heads • Innovation • Employees, Investors • Customer experience, Business Value • Operations, Brand Equity, ESG Gain Heads
Cost Heads: Account for obvious and non-intuitive expenditure People Effort Technology team, business team, change management Opportunity Cost Return on best foregone option - Return on chosen option Hardware, software, infrastructure costs Technology Infrastructure Data initiatives, Technology capabilities Capability Building People Efforts • Technology • Infrastructure Opportunity Cost • Capability • Building
DRINK IT: Cost & Gain heads analysis “Drink it”
5. Tally Results: What’s your benchmark performance? Compare ROI across the firm, against competitors, and the industry Average payback (years) across industries Average payback (years) by org D&Amaturity “ The average payback on data investments is ~17 months Reference: ESIThoughtLabreport – Driving ROI from AI
DRINK IT: Benchmark ROI across industries and track progress Breakeven Benchmark Benefits and Cost Summary “Drink it” Payback in 1.2 years (Manufacturing industry average: 1.32 years) ROI: $ 4.00 M Investment: $ 4.25 M
Applying the learnings to your organization Is there a KPI or a metric that signifies it? Do you have a handle on all your costs? 02 04 01 03 05 For how many of your projects is the outcome crystal clear? Are you confident that your project improved the metric? Is your breakeven better than your industry average?
We regularly share our thought leadership through articles, talks and webinars Featured Talks We regularly speak in events and conduct webinars to share knowledge on getting value from data Whiteboard Series: Executive insights in under 5 minutes Webinar: How to structure your Analytics teams for the Best Outcomes Panel: Role of AI Strategy and Culture in Org Transformation Webinar:How to Build Successful Data Science Teams Webinar: The best way to Choose your Data Science Projects We frequently publish articles in leading magazines to share insights with executives and practitioners Featured Publications How NGOs can leverage AI without breaking the bank How to beat resistance to AI projects: 3 steps for executives When and how to build out your data science team The 5 roles that every data science team must hire Why data leaders must play offense during COVID-19
Thank You! Reach out for a free discovery session: https://gramener.com/data-advisory-workshop Ganes Kesari @kesaritweets www.gramener.com /gkesari
Planning starts early but realization happens at later stage EXECUTION REALIZE VALUE DATA CULTURE VISION PLANNING Data Insights & Recommendation Action Most of the organizations leave their data initiatives at the action stage which not only makes them suffer in quantifying ROI but also makes their data initiatives less successful Reference: Gramener toolkit
Here’s a short & simple poll to help you reflect. Poll #1 Which of these is the biggest challenge for your organization?
Here’s a short & simple poll to help you reflect. Poll #2 Have you ever quantified ROI for your data initiatives?
Here’s a short & simple poll to help you reflect. Poll #3 Which of these 5 steps do you need help with?