Download
1 / 1
10 likes | 159 Views
I. Sampling design. Aim and context. IV. Genes within taxa.

E N D
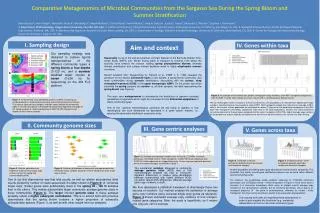
I. Sampling design Aim and context IV. Genes within taxa Our sampling strategy was designed to capture typical representatives of the different community types a spring bloom at four depths (0-120 m), and a summer stratified water column at seven (0-250 m) for sequencing on the 454 FLX platform. a Seasonality is one of the well-documented, constant features of the Bermuda Atlantic Time-series Study (BATS) site. Winter mixing leads to transport of nutrients from below the euphotic zone towards the surface, fuelling spring phytoplankton blooms; whereas thermal stratification and surface nutrient depletion result in highly oligotrophic summer conditions. Recent bacterial SSU fingerprinting by Treusch et al. (ISME J. 3: 1148) revealed the presence of four distinct community types in this system: a spring bloom community; and three communities during summer stratification, associating with the surface, deep chlorophyll maximum (DCM), or the upper mesopelagic (UMP). On this poster, we further subdivide the spring samples into surface vs. all other samples, the latter representing the spring bloom (see Figures). Comparative Metagenomics of Microbial Communities from the Sargasso Sea During the Spring Bloom and Summer Stratification b Figure 5.An example of estimated taxon specific average gene copy numbers: some ABC transporter components from the SAR 11 clade. Dots indicate the mean, lines the 95 % central posterior density interval. This work uses metagenomics to characterize the distribution of genomic encoded capabilities of organisms which might be connected to their differential adaptations of these community types. One of the general methodological questions we are trying to address is how meaningfully can such differences be described in a ‘gene centric’ manner, i.e., ignoring the taxonomic distribution of genomic traits. Figure 1. Characteristic taxon distribution profiles at BATS, illustrating our sampling design in relationship to seasonal and vertical community structure. The squares represent our samples, and their colors indicate the community types. a: relative abundance of Prasinophyte plastid SSU fragments and origin of the spring samples, b: relative abundance of SAR116 SSU fragments and location of the summer samples. We can extend gene centric analyses in at least two directions. One possibility is to estimate taxon specific gene copy numbers, illustrated here on the example of some SAR11 ABC transporter components. Note that on average, SAR11 cells in the summer surface population are estimated to harbour 1.5 genes for the periplasmic component of the ABC type Fe3+ transporter (COG1840), significantly more than in the other populations; whereas the same enrichment cannot be observed for the permease component of the same transporter (COG1178). Higher average copy numbers for the periplasmic subunit might by connected to the fact that iron concentrations in the summer are often limiting. Bánk Beszteri1, Kevin Vergin1, Alexander Treusch1, Weizhong Li2, Angela Norbeck3, Carrie Nicora3, Adam Monier4, Craig A. Carlson5, Jessica L. Green6, Alexandra Z. Worden4, Stephen J. Giovannoni1 1. Department of Microbiology, Oregon State University, Corvallis, OR, USA. 2. California Institute for Telecommunications and Information Technology, University of California, San Diego, CA, USA. 3. Biological Science Division, Pacific Northwest National Laboratories, Richland, WA, USA. 4. Monterey Bay Aquarium Research Institute, Moss Landing, CA, USA. 5. Department of Ecology, Evolution and Marine Biology, University of California, Santa Barbara, CA, USA. 6. Center for Ecology and Evolutionary Biology, University of Oregon, Eugene, OR, USA. II. Community genome sizes V. Genes across taxa III. Gene centric analyses Figure 4. Estimated average copy numbers over all taxa for COG0004 (ammonia permease), COG2223 (nitrate / nitrite transporter), COG0778 (nitrate reductase) and COG1251 (nitrite reductase) on a logarithmic scale. Curves represent posterior densities for the five community types as defined in Figure 1. Figure 6.COG0004 (ammonia permease) absolute counts per sample and taxonomic category Figure 7.COG2223 (nitrate / nitrite transporter) absolute counts per sample and taxonomic category Figure 2. Relative abundances of fragments of 35 universal single copy markers across the spring and summer depth profiles. Figure 3. Posterior distributions of community average genome size estimates across samples, based on relative abundances of 35 single copy markers. Another possibility is breaking down gene abundances into taxonomic categories. This illustrates that similar overall gene distribution patterns can be have rather different taxonomic backgrounds. For instance, the qualitatively similar patterns observed for COG0004 (ammonia permease) and COG2223 (nitrate / nitrite transporter) in Figure 4 have much less in common in a taxonomic breakdown. Both occur at highest overall average copy numbers in the spring bloom samples, but for ammonia permease, this is due to an increased presence of the gene in proteobacteria, whereas for nitrate / nitrite transporter, the major spring contributor seems to be eukaryotic phytoplankton. The substantial variation observed in community average genome sizes (AGS) was a first methodological obstacle we had to overcome. Apparent differences in relative gene abundance between communities with highly different AGSs can either reflect AGS differences, different average gene copy numbers, or both. One of our first observations was that total counts, as well as relative abundances (total counts divided by number of reads sequenced; the latter shown in Figure 2) of “universal single copy” marker genes were substantially lower in the spring 40 - 120 m samples than in the others. This implies substantially larger community average genome sizes in these communities (Figure 3). The largerinferred genome sizesin these samples probably reflect a higher eukaryotic contribution. This is in accord both with previous observations that the spring bloom contains a higher proportion of eukaryotic phytoplankton species (Figure 1), as well as with other results from our analyses. We thus developed a statistical framework to disentangle these two sources of variation. Our method enables the estimation of average gene copy numbers using universal single copy genes as reference. Figure 4 shows estimated average copy numbers of four nitrogen-related gene categories. Note: the scale is logarithmic, so 0 means one copy per cell on average. Our ongoing work aims at integrating these perspectives in order to gain insights into functional (e.g., metabolic) differentiation of the four microbial community types.