COHA 8/22/03
20 likes | 164 Views
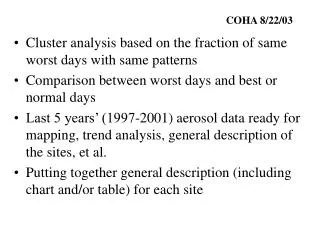
COHA 8/22/03. Cluster analysis based on the fraction of same worst days with same patterns Comparison between worst days and best or normal days Last 5 years’ (1997-2001) aerosol data ready for mapping, trend analysis, general description of the sites, et al.

COHA 8/22/03
E N D
Presentation Transcript
COHA 8/22/03 • Cluster analysis based on the fraction of same worst days with same patterns • Comparison between worst days and best or normal days • Last 5 years’ (1997-2001) aerosol data ready for mapping, trend analysis, general description of the sites, et al. • Putting together general description (including chart and/or table) for each site
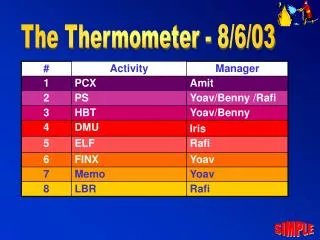
Cluster Analysis Based on the Fraction of Same Worst Days with Same Patterns* • * 8 Patterns: • S • N • OC • EC • Soil • CM • Pollution Species • Soil and CM